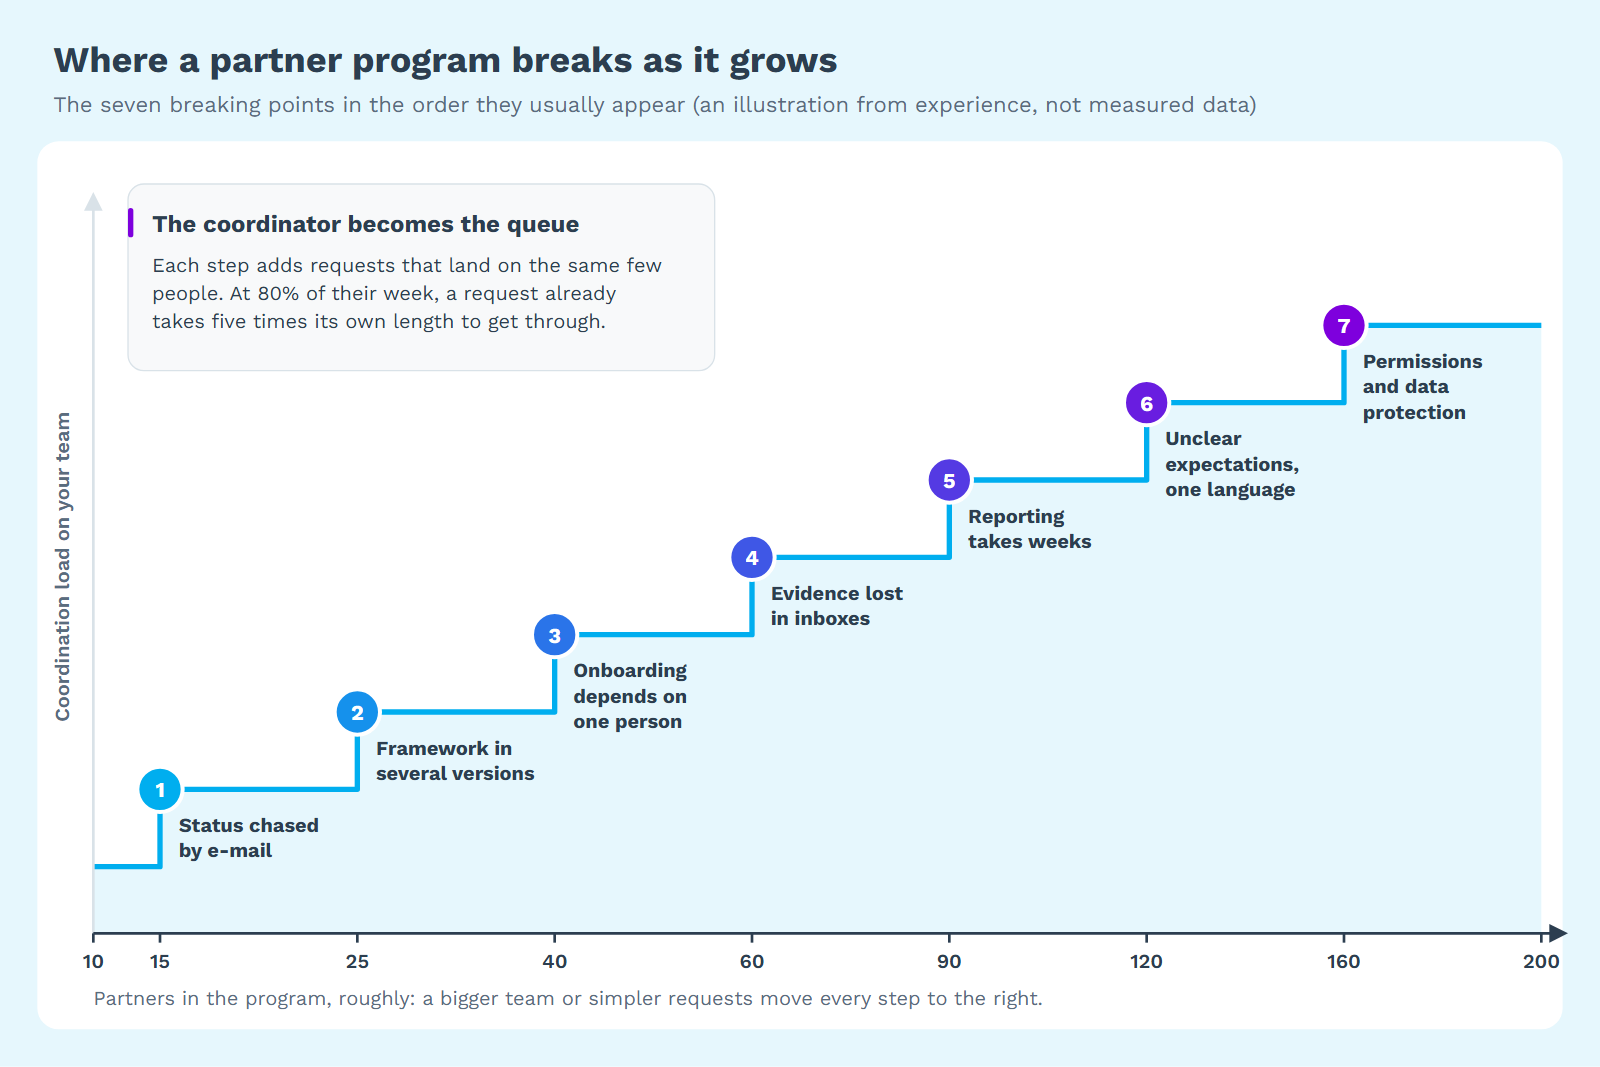
Partner programs rarely break at 10 partners. At 10, the coordinator knows every partner director by name, status is a phone call and the annual report takes an afternoon. They break on the way to 200, when the same coordinator starts each Monday with an inbox full of status replies, a framework that exists in three versions and a board report that will take weeks.
Nothing dramatic happens. The program crosses a series of thresholds, and habits that worked at 10 partners stop working one at a time. This is how to scale a partner program without that slow collapse: the seven breaking points in the order they usually appear, why each one breaks at that size, and how to fix it, practice first and tool second. Plus a one-page readiness checklist for your team.
Why partner programs break in steps: the coordinator becomes the queue
Before my digital transformation work, I taught operations research at the University of Porto: the mathematics of queues, bottlenecks and capacity. Through that lens, the steps make sense.
In most programs, almost every request passes through one or two people: the coordinator who answers questions, checks documents, chases status and assembles reports. In queueing terms, the coordinator is the server and every request is an arrival.
Little's law says that the average number of items in a system equals the rate at which they arrive times the average time each one spends there [1]. The pile of open requests in the coordinator's inbox is not a lack of discipline; it is arrivals times waiting time.
A second result is less intuitive. In the simplest single-server queue, the average time a request spends in the system is its handling time divided by one minus the server's utilization [2]. At 50% busy, a request takes twice its handling time to get through; at 80%, five times; at 95%, twenty. Waiting does not grow in a straight line with the workload. It explodes as the week fills up.
An illustration, with assumptions you should replace with your own: one coordinator has 20 hours a week for partner requests, and each partner sends one request a week that takes 20 minutes to handle.
- 10 partners: just over 3 hours a week. The coordinator is 17% busy, and requests barely wait.
- 50 partners: almost 17 hours. 83% busy, and the average request takes six times its handling time to get through.
- 60 partners: all 20 hours. The queue never settles; it keeps growing.
The coordinator did not get slower; the arithmetic changed. The same arithmetic gives the order of the fixes, as on any production line: first reduce the arrivals (partners find answers without asking), then shorten the handling (every request in the same shape, in the same place), and only then add people. Hiring on its own only moves the wall: under the same assumptions, two coordinators hit it at 120 partners.
The seven breaking points, in the order they usually appear
1. Status is chased by e-mail (from about 15 partners)
Symptom. Every month someone e-mails every partner to ask where they are, chases the late ones and copies the answers into a spreadsheet. By the time the last reply arrives, the first is out of date.
Why it breaks here. A status round is pure arrivals: one message out and one reply in per partner, plus the reminders. At 15 partners it is an afternoon. With 200 partners and a monthly round, it is 2,400 requests a year before the first reminder.
The fix. Stop asking for status; make it visible. Agree with partners what progress means in observable terms (a stage reached, a task done, a document accepted), so that status becomes a by-product of the work.
2. The framework lives in several versions (from about 25)
Symptom. The framework is a PDF from two years ago, an updated Word file and a workshop slide someone improved. Partners who joined in different years work towards different definitions of the same stage.
Why it breaks here. At 10 partners, a change is announced in one meeting and everyone hears it. At 25, changes travel by attachment, and every copy is a fork.
The fix. One owner, one current version, a change log and a date when each change takes effect.
3. Onboarding depends on one person (from about 40)
Symptom. New partners are onboarded by the person who designed the program, in one long call. When that person is on leave, onboarding waits; when they leave, the program's memory goes with them.
Why it breaks here. Onboarding is a request with a long handling time, and programs tend to add partners in cohorts. Fifteen new partners in the same month land on the same calendar.
The fix. Write onboarding down: a short welcome pack, the first three steps, who to ask about what. The first call can then be about the partner, not the program.
4. Evidence is scattered across inboxes (from about 60)
Symptom. Policies, audits, training lists and photos arrive as attachments to whoever the partner knows best. Before an audit or a donor visit, the team spends days searching mailboxes.
Why it breaks here. Evidence grows with partners times requirements, and it lands in personal inboxes that colleagues cannot see. Mind the load on the other side: a 2016 ICVA study of donor conditions on humanitarian NGOs found an average of 36 reporting deadlines per country per year, and partner capacity assessments that could run to more than 100 questions and up to 91 annexes [3]. Your partners carry a version of that load for you.
The fix. Request each piece of evidence once, with a due date, linked to the requirement it proves. Ask only for what someone will read.
5. Reporting takes weeks (from about 90)
Symptom. The annual report begins with an e-mail asking every partner for numbers, continues with weeks of merging files, and ends with a chart nobody can trace back to its source.
Why it breaks here. At this size, reporting is assembly: if the data was not collected in one structure during the year, someone builds it at the end, by hand. The same ICVA study describes an INGO that calculated it could save 11,000 hours of financial reporting if its nine largest donors agreed on cost definitions and accepted the same finance template [3]. In the 2016 Grand Bargain, donors and aid organizations committed to reduce duplication and management costs, and to simplify reporting: less volume, common terminology, core requirements and a common report structure [4].
The fix. Choose a handful of KPIs before the year starts, define them the same way for every partner, and collect them as the work happens. The report becomes an extract, and the weeks go into reading it.
6. Partners don't know what is expected, or can't work in their language (from about 120)
Symptom. The same questions keep coming: what do we need for the next stage, which template, by when. Partners in some countries reply late or not at all, and it is read as disengagement.
Why it breaks here. By now the program crosses borders, while the expectations still live in one language. The authors of a 2021 Humanitarian Exchange article noted that global guidance and technical tools are usually available only in UN official languages, and that coordination meetings in international languages compound the problem [5]. Silence is often a language problem, not a motivation problem.
The fix. Describe each stage in plain, observable terms and translate it together with its templates. Every question the page answers is a request that never reaches the queue.
7. Permissions and data protection (from about 160)
Symptom. The shared folder has hundreds of people with access, nobody is sure who can see which partner's assessment, and the data protection officer has questions no one can answer.
Why it breaks here. At 10 partners, one shared folder is convenient. At 200, it is a liability: partner records hold personal data and sensitive assessments, and access granted by hand is rarely removed. The European Commission's guidance on data protection by default is that personal data should be accessible "only to a limited number of persons, on a need-to-know basis" [6].
The fix. Define roles before the next cohort joins: who on your team sees and changes what, and the rule that a partner sees its own data and nothing else. Review access when people join or leave.
What a tool must do at each breaking point
Practices come first: a tool that automates a broken process only breaks it faster. Then, this is what partner management at scale asks of a tool:
| Breaking point | Practice first | What a tool must do |
|---|---|---|
| Status chased by e-mail | Make status a by-product of the work | Let partners record progress where they work, and show you every position without asking |
| Framework in several versions | One owner, one version, a change log | Hold one framework for all partners, edited together, with changes reaching everyone at once |
| Onboarding depends on one person | A written welcome pack | Show each new partner, from its first sign-in, where it stands and what its next step needs |
| Evidence lost in inboxes | One request per piece of evidence | Attach each upload to the step it proves, and show what is missing across all partners |
| Reporting takes weeks | A few KPIs, defined up front | Keep KPIs per partner with their history, and produce reports from that data |
| Unclear expectations, one language | Plain stage descriptions, translated | Show each partner its position and next step in its own language |
| Permissions and data protection | Roles before the next cohort | Enforce roles, keep each partner to its own data, support your organization's sign-in, say where files are stored |
A one-page scaling readiness checklist
The checklist turns the seven breaking points into 21 statements, plus the coordinator arithmetic with room for your own numbers. Run it with your team before the next group of partners joins, and start with the first section that has two or more empty boxes.
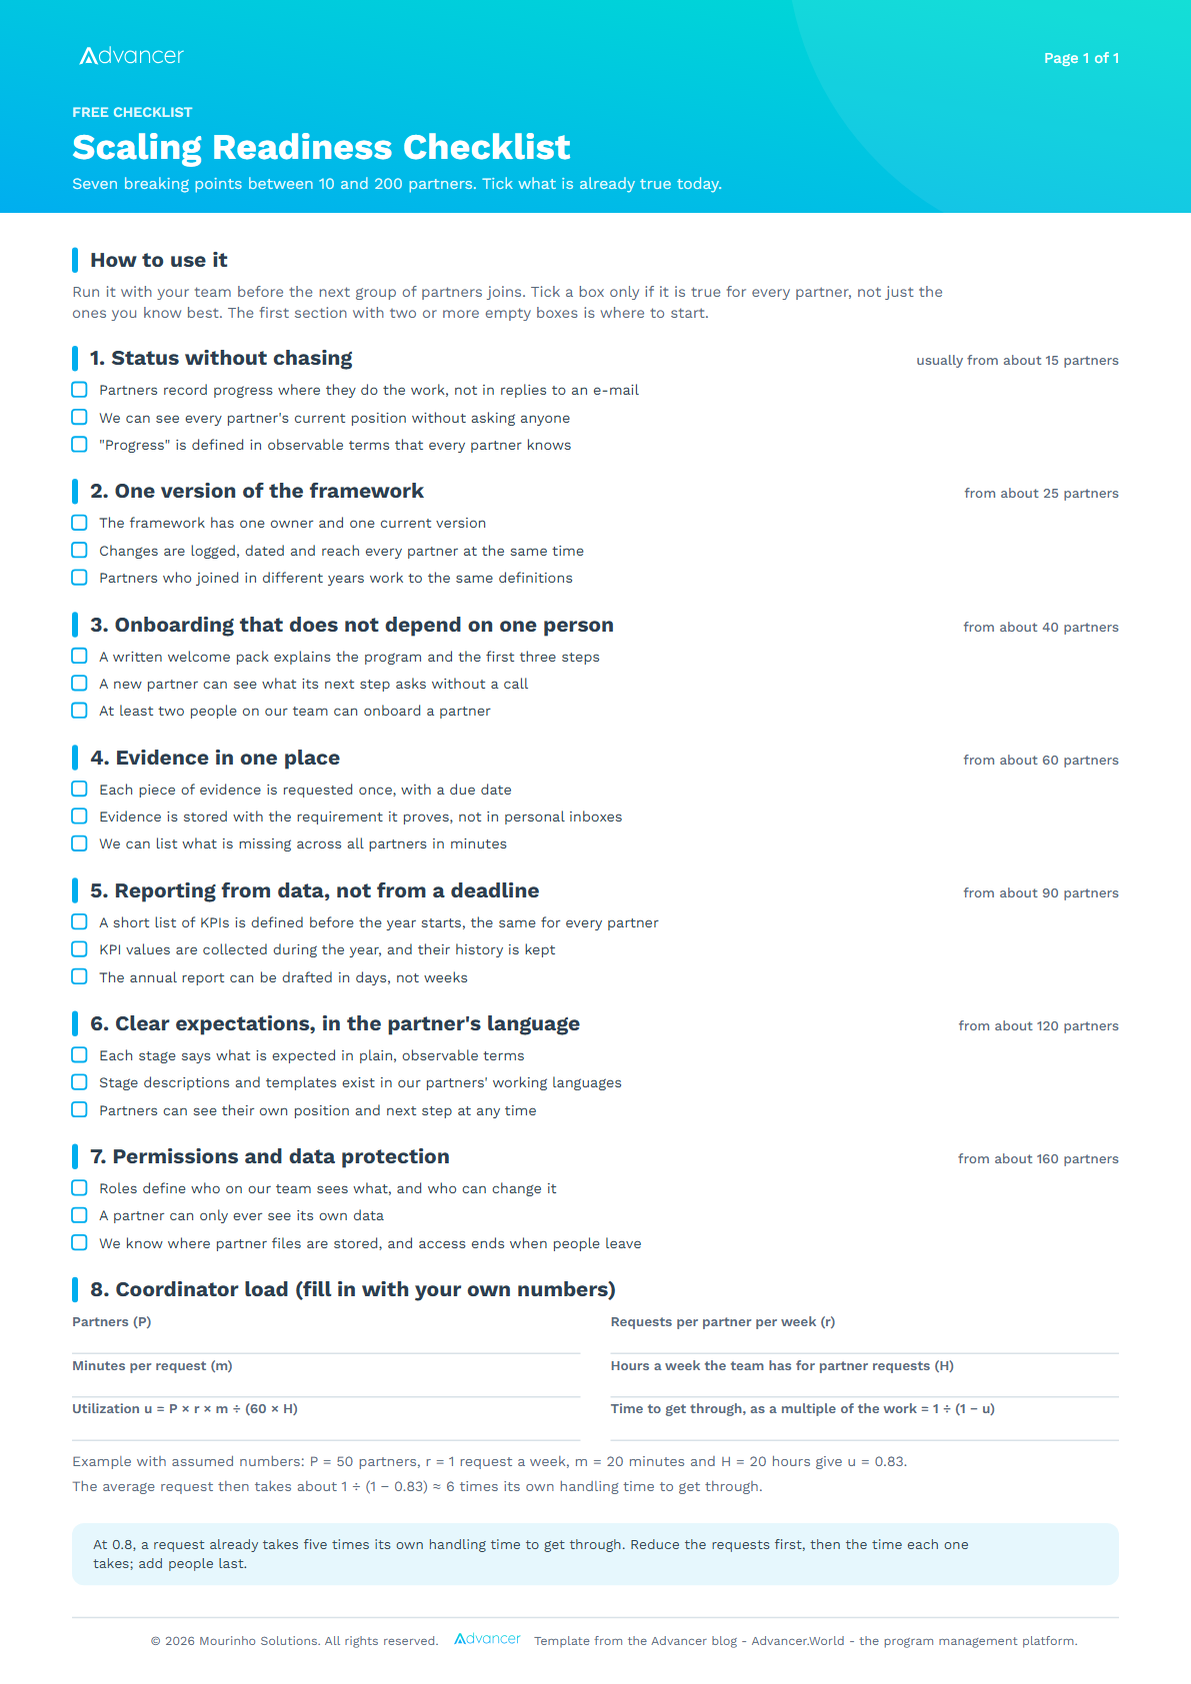
Download the scaling readiness checklist (PDF, 1 page). Print it for a team meeting.
Already past the second breaking point? In Advancer.World every partner works on one version of your program, sees its own position and what the next stage asks in its own language, and sends evidence to the step it belongs to. Your team sees where each partner stands instead of asking. Free to start.
Partner management at scale in Advancer.World
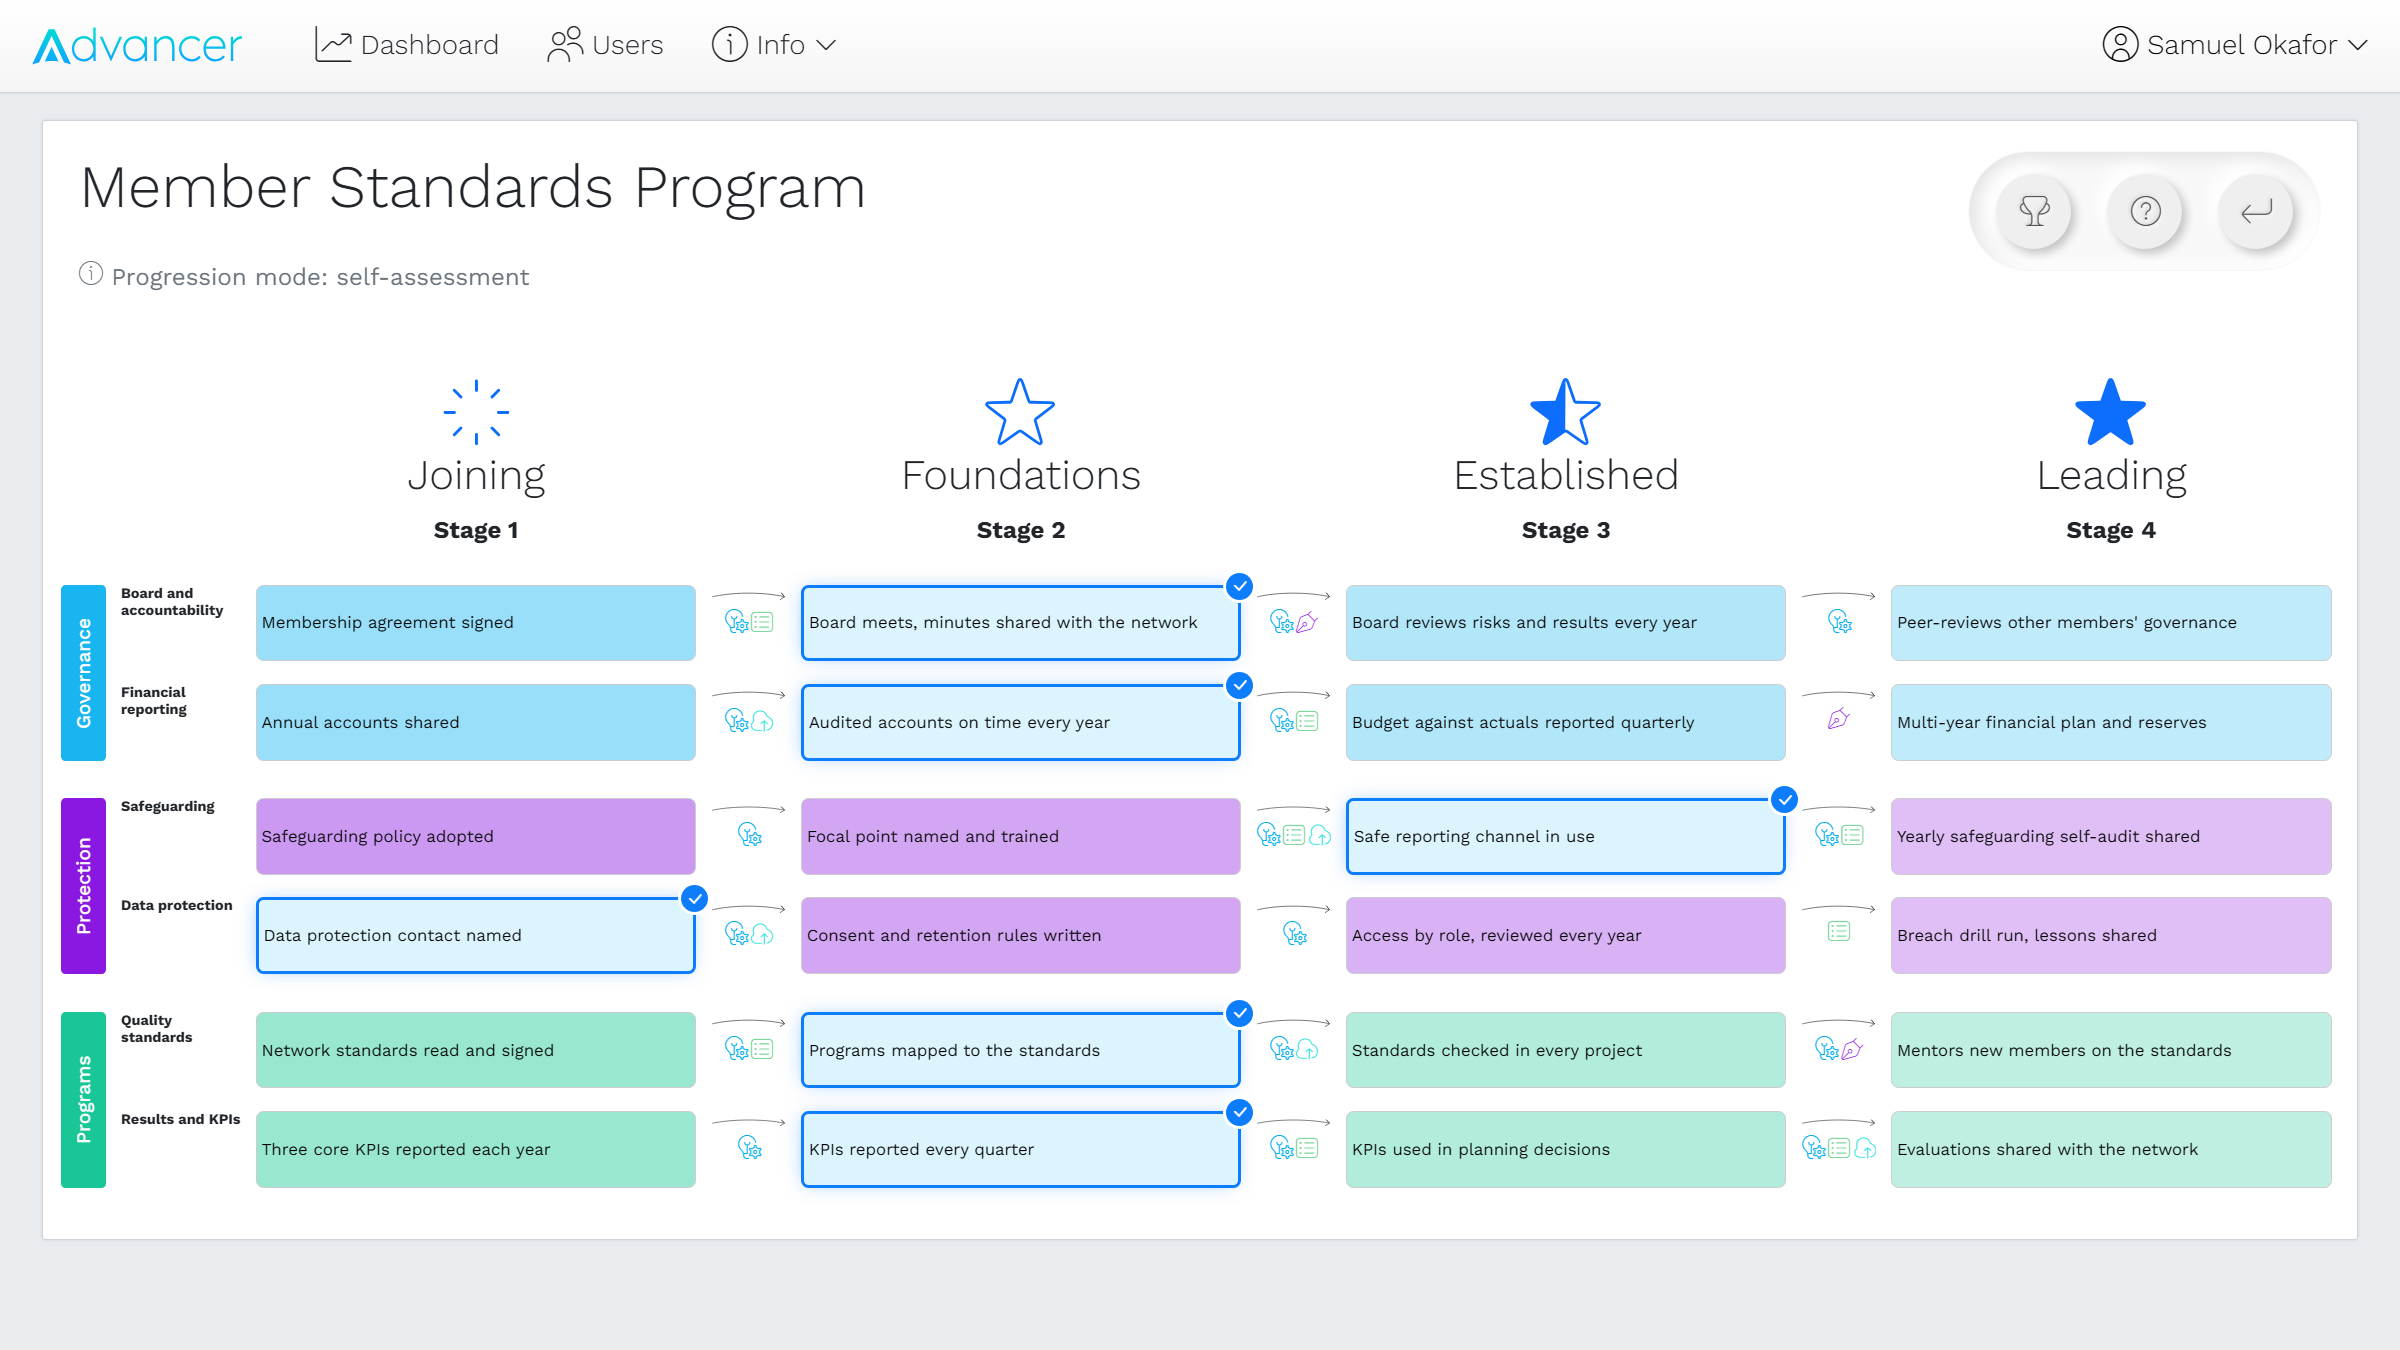
Advancer.World was born from the digital transformation of programs at organizations such as UNICEF and Airbus. A program is one grid, designed once: stages on one axis, topics and subtopics on the other, each cell describing what that stage looks like for that topic. Several people on your team can design it at the same time, and every partner works on the same version.
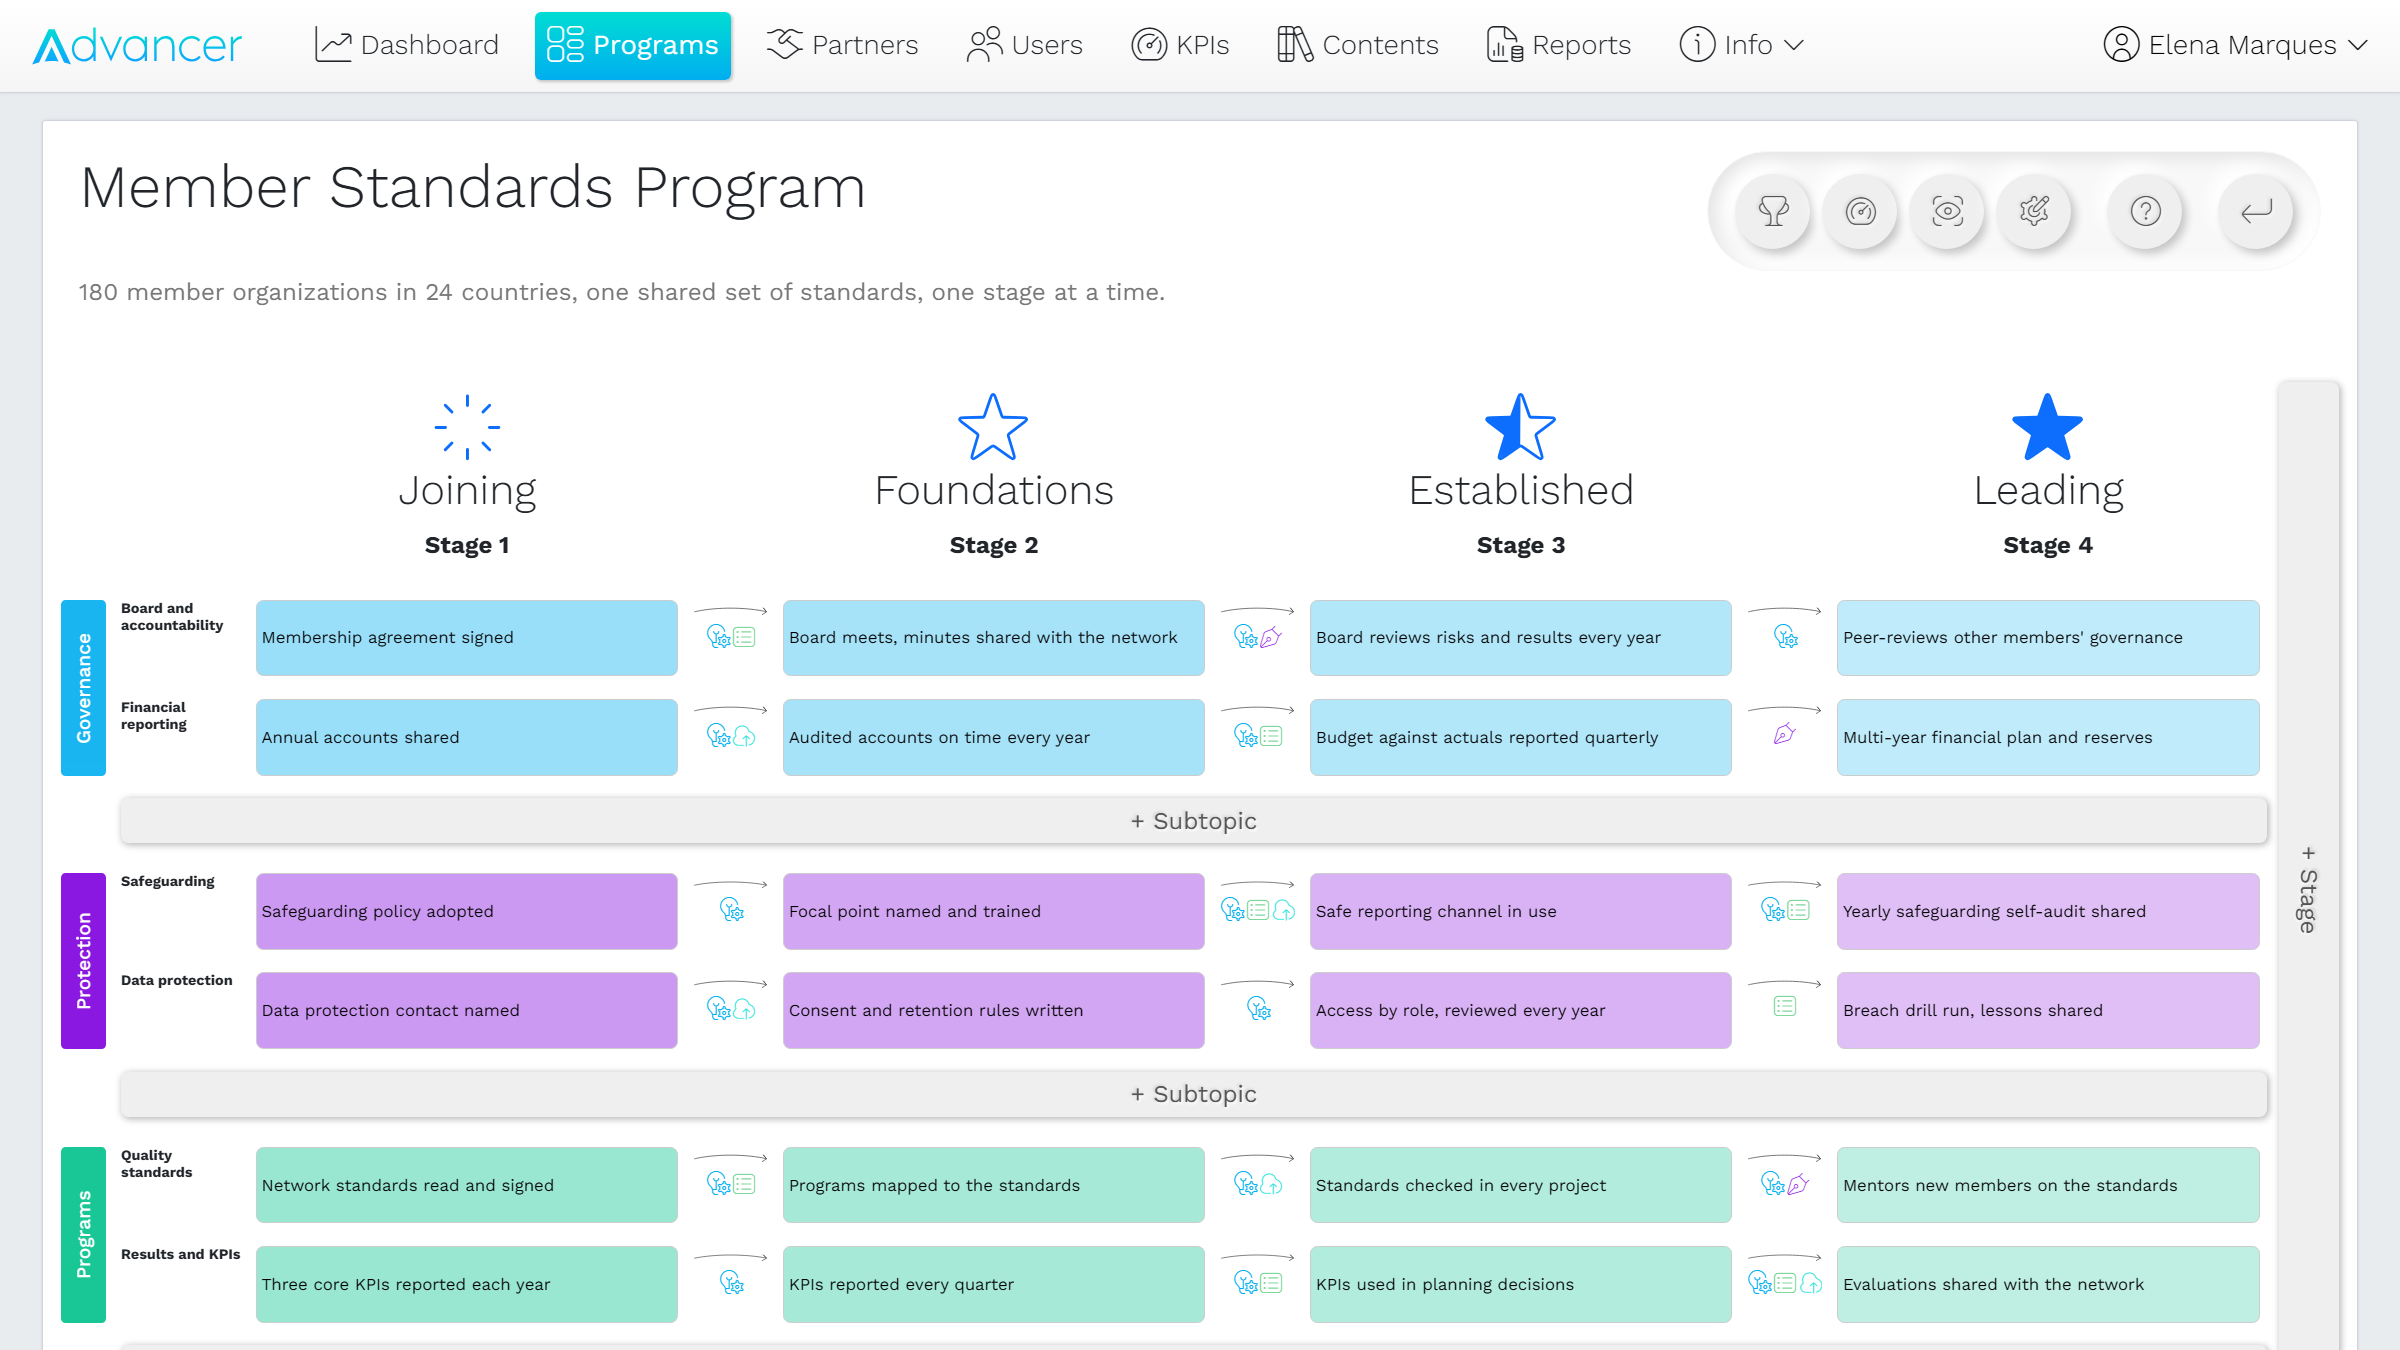
The steps between cells carry the work: initiatives, questionnaires, document upload requests and e-signature requests. You choose per program how partners move forward: by self-assessment, automatically when the previous step is complete, or when your team confirms it. Partners are invited by e-mail and see their own position and what the next stage asks, in any of 22 languages, including Arabic, Urdu, Swahili and Hausa. They never see other partners' data, and partners and their people never pay.
KPIs are recorded per partner and daily snapshots keep the history, so the Excel reports and the AI-written Word reports with charts come from data gathered during the year. Your organization can sign in with Microsoft Entra ID, files are stored in the EU, and on the Gold and Enterprise plans an AI assistant can read where your partners stand through the MCP server. If MCP is new to you, start with what Model Context Protocol is.
FAQ
How many partners can one coordinator manage?
There is no fixed ratio. Multiply the partners by the requests each sends per week and the minutes each request takes, then divide by the minutes your coordinator really has for partner work. That is the utilization. At 80%, the average request already takes five times its handling time to get through.
When should we move a partner program off spreadsheets and e-mail?
When two of the first four breaking points show at the same time, or before the next group of partners joins, whichever comes first. For help bringing existing data across, Mourinho Solutions offers migration support.
Will a platform add work for our partners?
It should remove work. A partner that answers status e-mails, sends attachments to three people and fills in a different template for each funder is already doing the work; a shared place only changes where it goes. Ask two or three partners to try it first.
How to scale a partner program without breaking it
You do not need to fix all seven at once. Find the first breaking point your program has already crossed, fix that one, and do the coordinator arithmetic before the next cohort joins. A program that scales well does not have a heroic coordinator. It has a coordinator whose week is not full. For a second pair of eyes on the program design itself, there is our program consulting.
Run 10 or 200 partners on the same grid. Design your program once, invite your partners, and keep the evidence, the KPIs and the history in one place instead of your inbox. Free to start.
References
- John D. C. Little, "Little's Law as Viewed on Its 50th Anniversary", Operations Research 59(3), pp. 536–549, May–June 2011, https://doi.org/10.1287/opre.1110.0940 (accessed October 2026).
- Richard C. Larson and Amedeo R. Odoni, "Urban Operations Research", Prentice-Hall, 1981, section 4.6.1, "One operator, infinite number of lines", https://web.mit.edu/urban_or_book/www/book/chapter4/4.6.1.html (accessed October 2026).
- International Council of Voluntary Agencies (ICVA), "Less Paper More Aid: Reporting, Partner Capacity Assessment, and Audit", updated September 2016, https://alnap.org/help-library/resources/less-paper-more-aid-reporting-partner-capacity-assessment-and-audit/ (accessed October 2026).
- "The Grand Bargain: A Shared Commitment to Better Serve People in Need", Istanbul, 23 May 2016, https://gblocalisation.ifrc.org/wp-content/uploads/2018/06/grand_bargain_final_22_may_final-2_0.pdf (accessed October 2026).
- Mia Marzotto, Kemal Alp Taylan, Fatuma Ibrahim, Marian Ellen Hodgkin, Paul Martin Lukusa Mbwebwa and Charles Abugo, "'How can we contribute if we can't participate?' The accessibility of humanitarian guidance to local and national organisations", Humanitarian Exchange 79, Humanitarian Practice Network, 25 May 2021, https://odihpn.org/en/publication/how-can-we-contribute-if-we-cant-participate-the-accessibility-of-humanitarian-guidance-to-local-and-national-organisations/ (accessed October 2026).
- European Commission, "Obligations: data protection by design and by default", https://commission.europa.eu/law/law-topic/data-protection/information-business-and-organisations/obligations/what-does-data-protection-design-and-default-mean_en (accessed October 2026).
© 2026 Mourinho Solutions. All rights reserved.