It is the week before the board meeting, and the director asks a simple question: how many of our 46 member organizations have a safeguarding focal point in place? The answer lives in a spreadsheet. Two colleagues open two copies and get two different numbers, and a third remembers updates that arrived by e-mail and never reached the file. By Thursday you have a number you mostly trust.
That is usually the week someone starts looking for a partner management spreadsheet alternative. Before you do, a fair test, because Excel did not fail here: it was asked to do a job it was never designed for. Here are 12 signs that a partner program has outgrown its spreadsheet, how to notice each one and what it costs, a free 12-point check with a scoring guide, and what to look for if you move. For some programs the honest answer is to stay on Excel, and the guide says when.
First, a word in Excel's defense
I trained in operations research, and I have a soft spot for a well-built spreadsheet. For analysis, a quick what-if or the chart in a board paper, nothing beats it. Raymond Panko of the University of Hawaii, a long-time researcher of spreadsheet errors, puts it plainly: "spreadsheet programs are not error-prone. People are error prone." [1]
The trouble starts when one workbook becomes the system of record for a whole program: the only place where the status of 30, 50 or 100 organizations lives, updated by several people, copied out to partners and merged back. That is a database job, a workflow job and an access job at once. A spreadsheet can imitate all three for a while. The 12 signs below, in five groups, tell you when the imitation has stopped working.
Data: the file has become the system
1. Nobody is sure which file is the current one
How you notice it: two colleagues quote different numbers for the same partner, and meetings start with "which version is this?" Copies live on the shared drive, in inboxes and on laptops.
What it costs: decisions made on stale numbers, and hours spent reconciling. Once people stop trusting the master, they keep private copies, and it gets worse.
2. The spreadsheet has turned into a database
How you notice it: one tab per year, a column added every quarter, lookups between tabs, hidden columns nobody dares delete, and formulas only one person can explain.
What it costs: errors you cannot see. Per cell, people make few mistakes: human error research puts the rate at roughly 1% to 5% of cells. But a large workbook has thousands of cells, so at least one wrong total becomes very likely. When operational spreadsheets were inspected cell by cell, errors turned up in 94% of them, and in experiments people searching for errors on purpose found about 60% of them [1].
3. Last year's status has been typed over
How you notice it: someone asks where a partner stood a year ago, and the answer means digging an old copy out of e-mail, if it still exists.
What it costs: you can report a position, never a trajectory, and the trajectory is what boards and donors ask about: did our partners actually get stronger? I made the same point about running partner capacity assessments without spreadsheets: when next year's file replaces this year's, the progress leaves no trace.
People: the team works for the spreadsheet
4. The tracker depends on one person
How you notice it: "It's her file, ask her." When the owner is on leave, nothing gets updated, and the week after is spent catching up.
What it costs: the program's memory sits in one head. The day that person moves on, the logic behind the formulas and the story of every exception leave too.
5. Updating the tracker eats the time meant for partners
How you notice it: hours each week go into copying answers from e-mails into cells, and status meetings open with checking whether the numbers are right.
What it costs: do the arithmetic for your own team. Two hours a week for three people is close to 300 hours a year, about seven working weeks, spent maintaining a file instead of talking to partners.
Partners: the people doing the work cannot see it
6. Partners do not know where they stand or what comes next
How you notice it: partners ask "what do you need from us?", or wait to be told. The tracker is yours; they have never seen it.
What it costs: progress depends on your chasing instead of their own initiative. A partner that sees its position and the next step can plan for it; a partner that only hears from you at report time cannot.
7. You chase partners for things they already sent
How you notice it: "I sent that in March." The policy, the audit or the minutes are somewhere in an inbox, not next to the status they support.
What it costs: partner goodwill, the one resource a partner program cannot buy. And when a donor asks for the evidence behind a status, nobody can find it quickly.
8. You cannot show a partner its record without showing everyone's
How you notice it: a spreadsheet's access works per file, not per row, so you send each partner an extract and merge its corrections back by hand.
What it costs: with 50 partners, that is 50 files out and 50 back, each one a chance to paste a row in the wrong place.
Reporting: simple questions take days
9. Report season means weeks of merging and checking
How you notice it: the annual report starts with collecting files, not reading them, and totals change between the first and the third draft.
What it costs: weeks of staff time at the busiest moment of the year, and numbers you would rather not defend.
10. Simple questions take a day to answer
How you notice it: "How many partners are at stage 2 in safeguarding?" gets "I'll come back to you", and the answer depends on who builds the pivot table.
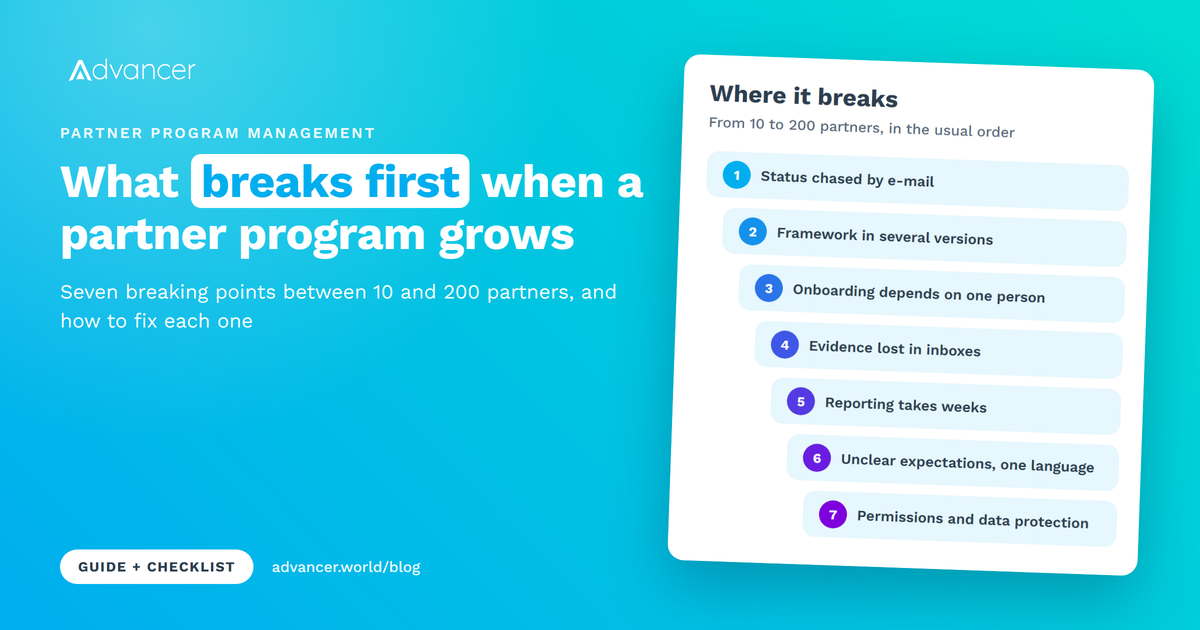
What it costs: leaders stop asking, and decisions get made on impressions. If your program is growing quickly, see also From 10 to 200 partners: what breaks first in a partner program.
Risk: errors and copies you cannot see
11. Personal data travels in attachments
How you notice it: the tracker holds the names, e-mails and phone numbers of partner contacts, and copies of it sit in inboxes, download folders and shared drives that nobody can count.
What it costs: under the GDPR, personal data has to be accurate and up to date, stored no longer than necessary and protected with appropriate technical and organizational measures, and your organization is responsible for demonstrating that it complies [2]. Every copy in an inbox is one more copy to correct, delete on time and protect.
12. A wrong number has already reached a report
How you notice it: a total in the board paper did not match the donor report, a filter was left on before a count, or a formula's range stopped at row 50 when partner 51 had joined.
What it costs: credibility, because spreadsheets fail quietly. In October 2020, Public Health England announced that 15,841 positive COVID-19 cases from 25 September to 2 October had been left out of the reported daily figures, because some files exceeded the maximum size the automated process could handle [3]. The BBC explained the mechanism: lab results were pulled into Excel templates in the old XLS format, each could hold only about 65,000 rows, roughly 1,400 cases, and further cases were simply left off [4]. People still received their results; contact tracing was delayed [3][4].
Banks see it too. JPMorgan Chase's own task force on its 2012 trading losses, about $5.8 billion by the end of June that year, found that a risk model ran on Excel spreadsheets completed by copying and pasting data from one to another. A review group had called the process "error prone" and "not easily scalable", and one formula divided by a sum instead of an average, which likely understated the risk measure [5]. The task force put principal responsibility on the traders and their strategy, not on the spreadsheet. But a quietly understated risk is exactly the failure nobody notices until it matters.
The 12-point check: score your program
Tick each sign that is true for your program today, not what might happen next year, and add them up:
| Score | What it means | What to do |
|---|---|---|
| 0 to 3 | Excel is doing its job. | Stay on Excel, and keep it tidy: one master file with version history, one owner and a backup, drop-down lists instead of free text, and a dated copy every quarter so the history survives. |
| 4 to 6 | Excel is straining. | Fix the process before the tool: partners send updates through one form instead of their own copies, and you write down the program's structure (stages, topics, what each step asks). Plan the move before your next annual cycle. |
| 7 to 9 | You have outgrown it. | Move the system of record within the next cycle. Start with each partner's current position and open items, give every partner a view of its own record, and keep Excel for analysis. |
| 10 to 12 | It is already costing you. | Errors and lost partner time are likely happening now. Freeze the spreadsheet's structure, name one owner, check your last report's numbers against their sources, and plan the move now. |
One adjustment: with fewer than 10 partners and one coordinator, read your score one band lower; a small program with a careful owner can run on a spreadsheet for years.
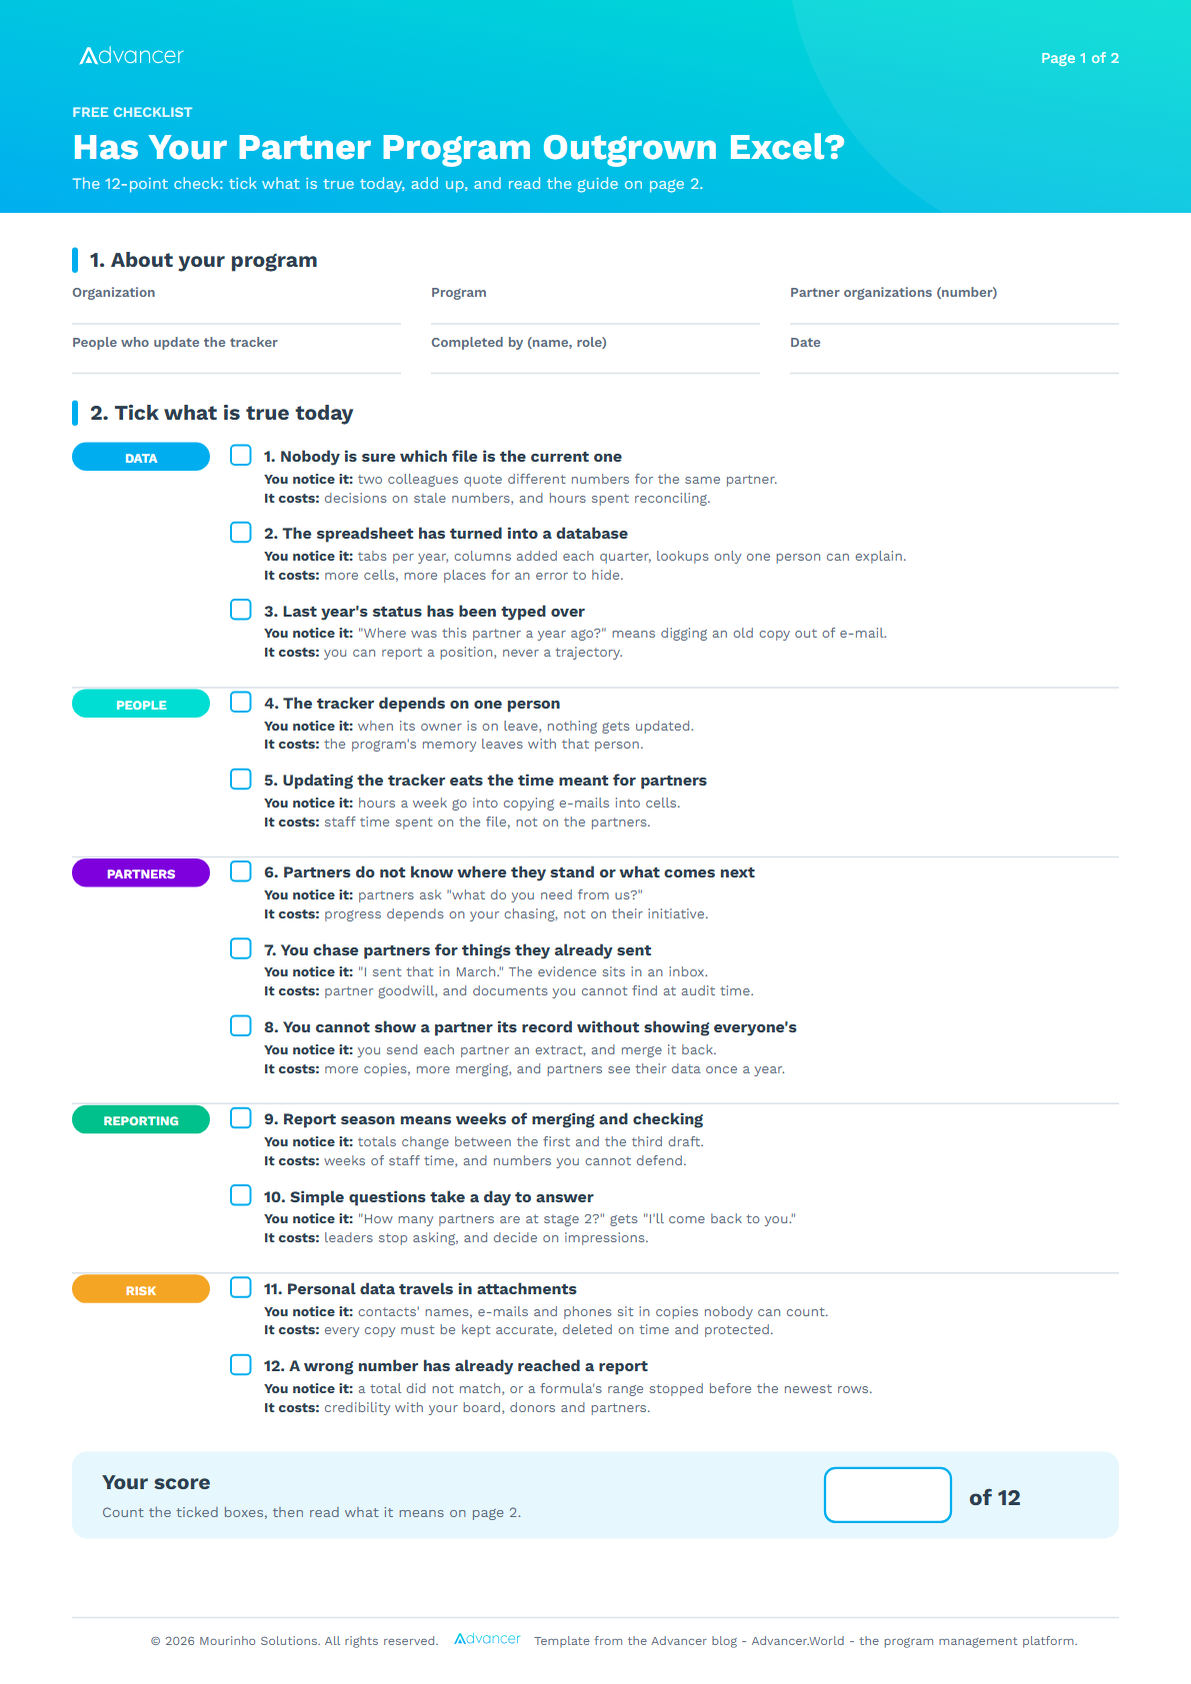
Download the 12-point check (PDF, 2 pages). There is also a filled-in example (PDF, 2 pages) for a fictional federation of 46 national members that scores 8.
Scored 7 or more? In Advancer.World your program becomes one grid that all your partners work on: each partner signs in, sees its own position and what the next stage asks, and uploads its evidence where it is requested. Every move is recorded, so the history is there when your board asks. Free to start, and partners never pay.
What a partner management spreadsheet alternative should do
If you decide to replace Excel for program management, do not shop for features: check each tool against the signs that made you move. A good alternative should:
- Keep one live record per partner, with no copies to send out and merge back. Signs 1, 8 and 9.
- Model your program, not a table: stages, topics and what each step asks, so a status is a position, not a free-text cell. Signs 2, 10 and 12.
- Keep the history by itself, so next year starts from this year. Sign 3.
- Belong to the team, not to a person, with roles and shared access. Signs 4 and 5.
- Let partners sign in and see their own record, and only theirs, with what comes next and a place to send evidence. Signs 6, 7 and 8.
- Answer questions from the same data, and export to Excel for the analysis your team already knows. Signs 9 and 10.
- Treat personal data properly: access by role, no attachments in transit, a clear answer on where data is stored. Sign 11.
- Cost partners nothing. A tool partners must pay for, or spend weeks learning, will not be used by all of them.
Running the program in Advancer.World
Advancer.World was born from the digital transformation of programs at organizations such as UNICEF and Airbus, and it is built around the structure most partner spreadsheets try to imitate. A program is a grid: stages on one axis, topics on the other, each cell describing what that level looks like. The steps between cells carry the work: initiatives, surveys, document upload requests and e-signature requests.
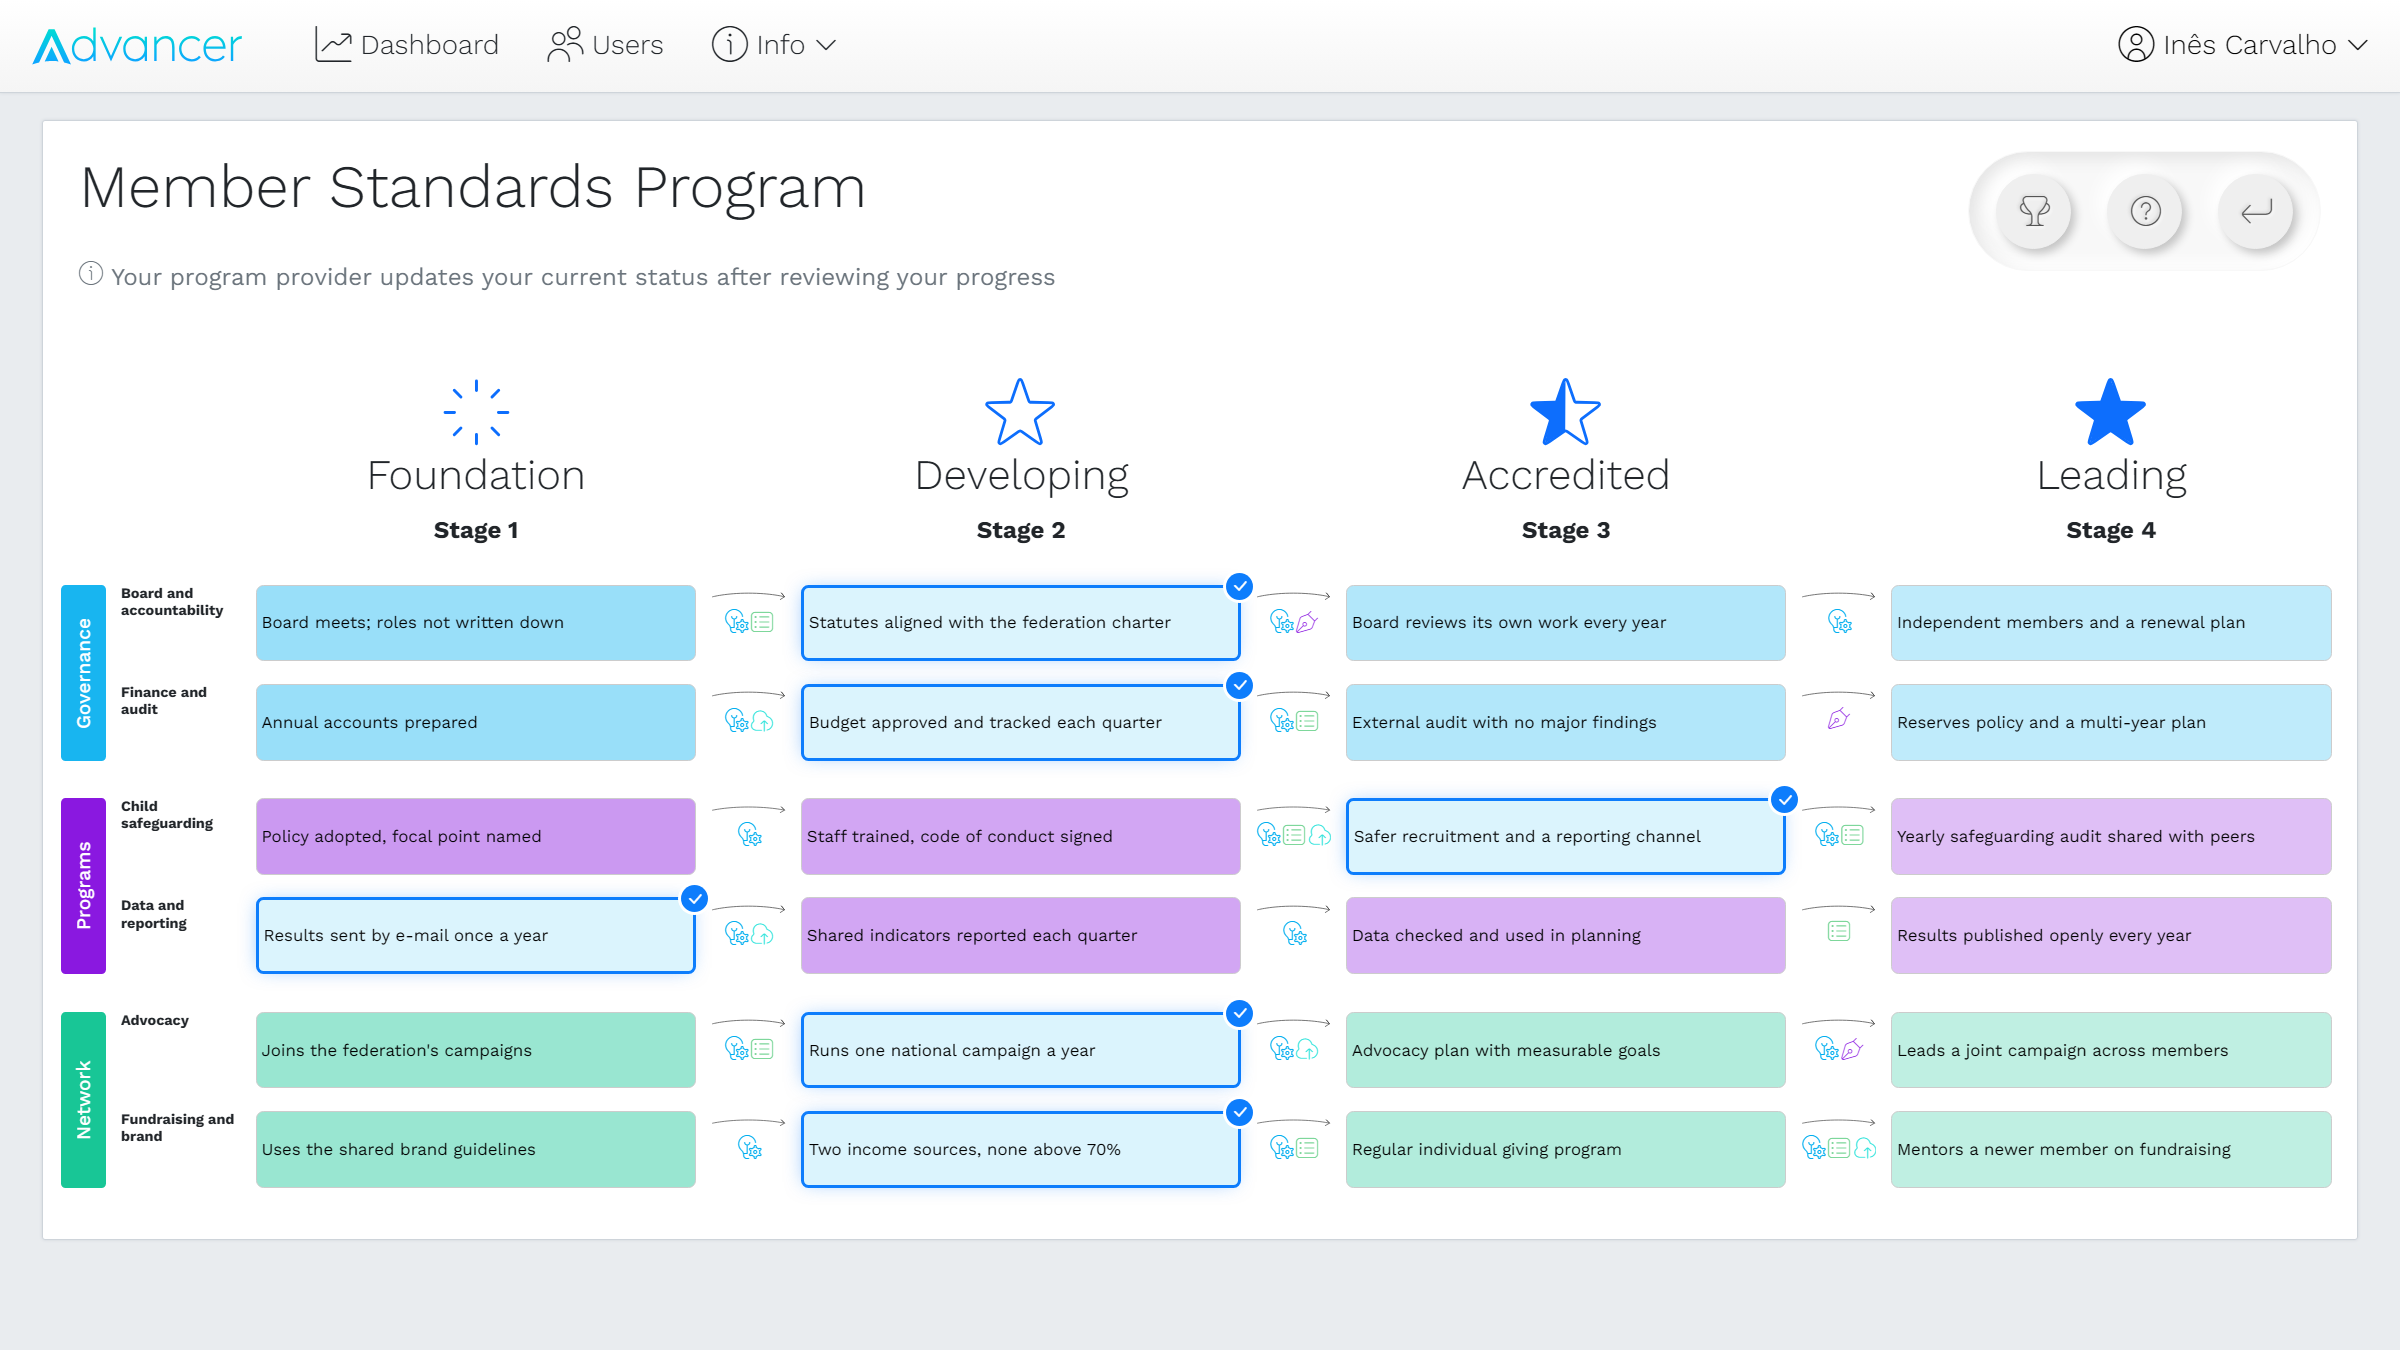
Partners are invited by e-mail, sign in and see their own position and what the next stage asks; they never see another partner's data, and they never pay. Each program sets how partners move: by self-assessment, automatically when the previous step is complete, or when your team confirms it, as in the federation above. KPIs are recorded per partner, and daily snapshots keep the history, so trends are there without a single merge. The platform works in 22 languages, and reports come out as Excel files for your analysis or as AI-written Word reports with charts. On the Gold and Enterprise plans, the REST API and the MCP server can tell your own systems, or Claude and ChatGPT, how partners are spread across the stages.
FAQ
How many partners is too many for a spreadsheet?
There is no magic number. A careful coordinator can run 40 partners in a well-built workbook, and a team of five can lose control of 12. Count the signs, not the partners: the people who update the file matter more than the rows.
Can't we just share the spreadsheet in SharePoint or Google Sheets?
Co-editing one shared file solves sign 1 and helps with sign 3, because these tools keep a version history. It does not solve the partner signs: anyone who can open the file sees every row, so you still cannot give 50 organizations a view of only their own record, and evidence still arrives by e-mail.
Do we have to migrate years of history?
No. Start with each partner's current position and the items you are still waiting for, and keep the old files as a read-only archive for the rare question about 2022. From the day you move, the history builds itself. If you would rather not do it yourself, Mourinho Solutions offers a migration service.
Keep Excel, change its job
If you scored 0 to 3, close this tab and go back to your spreadsheet with a clear conscience. If you scored higher, remember that the tool is not the problem; its job is. As Director of Innovation at SISTRADE, working on ERP and manufacturing software, I saw the same pattern in factories that I now see in partner networks: the spreadsheet rarely breaks on day one. It breaks when too many people depend on it.
Move the master record, keep Excel for analysis. Advancer.World gives every partner one place to see where it stands and send what is asked, and gives your team the live record and Excel reports from the same data. Free to start.
References
- Raymond R. Panko, "What We Don't Know About Spreadsheet Errors Today: The Facts, Why We Don't Believe Them, and What We Need to Do", Proceedings of the EuSpRIG 2015 Conference "Spreadsheet Risk Management", European Spreadsheet Risks Interest Group, 2015, https://arxiv.org/abs/1602.02601 (accessed October 2026).
- European Commission, "Principles of the GDPR", https://commission.europa.eu/law/law-topic/data-protection/information-business-and-organisations/principles-gdpr_en (accessed October 2026).
- Public Health England, "PHE statement on delayed reporting of COVID-19 cases", 4 October 2020, https://www.gov.uk/government/news/phe-statement-on-delayed-reporting-of-covid-19-cases (accessed October 2026).
- Leo Kelion, BBC News, "Excel: Why using Microsoft's tool caused Covid-19 results to be lost", 5 October 2020, https://www.bbc.co.uk/news/technology-54423988 (accessed October 2026).
- JPMorgan Chase & Co., "Report of JPMorgan Chase & Co. Management Task Force Regarding 2012 CIO Losses", 16 January 2013, archived copy: https://web.archive.org/web/20131231135201/http://files.shareholder.com/downloads/ONE/2272984969x0x628656/4cb574a0-0bf5-4728-9582-625e4519b5ab/Task_Force_Report.pdf (accessed October 2026).
© 2026 Mourinho Solutions. All rights reserved.