The quarterly figures from forty partners arrive the week before the board meeting. One line adds up the young people trained, and it looks like a good quarter. Then the questions start. One partner counted every session attended, another only those who finished the course, a third included its own volunteers. The total is correct arithmetic, and it means almost nothing.
Nobody did anything wrong; the program never wrote down which question it was asking. That is the first problem of KPIs for partner programs: every loose definition gets added up. This guide covers a small shared core of KPIs, a reference sheet for each one (a free template with a filled-in example), aggregation rules that tell the truth, the checks to run first, KPIs that follow a partner's stage, and how many is too many.
Why KPIs for partner programs are different
The OECD's evaluation glossary defines key performance indicators as the subset of indicators considered most important to the goals, monitored in an ongoing way, and notes that any indicator is "always approximate only" and needs interpretation [1]. With one partner, you can simply ask what they counted. With forty, three things change:
- Definitions become contracts. Each partner settles every ambiguity its own way, and the total mixes them. INTRAC lists what adding up across a portfolio requires: the same definitions, every relevant project collecting the data, similar timescales, the same tools and consistent quality [2].
- The burden multiplies. One more indicator is one more number for you, and forty for your partners, every round.
- Partners are not alike. Size, context and maturity differ, so the same number means different things in different places.
A small shared core, plus each partner's own
What works in most multi-partner programs is two layers. A shared core of five to eight KPIs that every partner reports with the same definition: the only numbers you add up. Then two or three partner-specific indicators each, chosen by the partner for its context and read partner by partner.
The IFRC's monitoring and evaluation guide describes the trade-off: standard indicators have accepted definitions and can be compared across projects, but can be unrepresentative of the local context, so a mix is often best [3]. INTRAC names the risk of standardizing everything: at worst, projects collect information that is of no use to them [2]. The partner-specific layer is also where the best indicators for implementing partners come from; some later earn a place in the core.
Outputs, outcomes and what a partner controls
In the OECD glossary, outputs are the products and services an intervention delivers, within the control of the implementing team; outcomes are their short and medium-term effects [1]. In a multi-partner program, that has two consequences:
- Outputs add up; outcomes resist it. INTRAC finds aggregation quite possible at output level and extremely difficult at outcome level, even where industry-standard definitions exist [2]. Outcome KPIs need your tightest definitions.
- Outcomes depend on context. A youth employment partner in a district with few jobs will not match one in the capital, however good its course. Compare each partner with its own baseline first.
A sound core holds both: outputs that show the work is happening, and one or two outcomes that show whether it matters.
Write every KPI down: the KPI reference sheet
Every core KPI needs a written definition before the first partner reports. The IFRC's M&E plan records, for each indicator, a detailed definition, its sources, the methods and timing of collection, the people responsible and the intended use. The definition should state precisely how the indicator is calculated, such as the numerator and denominator of a percentage, and how it is split by sex, age or other variables. People are named by job title too, so the indicator survives staff changes [3]. The template below adds three fields that matter when many partners report: the aggregation rule, the data quality checks and a version log.
| Field | What it settles | In the example |
|---|---|---|
| Definition | Every term a partner could read two ways | A graduate attended at least 80% of sessions; work means at least 10 hours a week |
| Numerator and denominator | What is counted, out of what | Graduates not reached at six months stay in the denominator |
| Source and frequency | Where the number comes from, and when | Course register and a follow-up call; quarterly |
| Aggregation rule | How partners' values are added up | Pooled rate, plus the partners at 50% or more |
| Quality checks | What is checked before adding | A numerator above its denominator goes back to the partner |
| Version log | What changed, when and why | Education and training added in version 1.1 |
The KPI reference sheet template (free download)
The template has two A4 pages: how to use it, the indicator, its definition and data collection (page 1); the aggregation rule, quality checks, limitations, version log and sign-off (page 2).
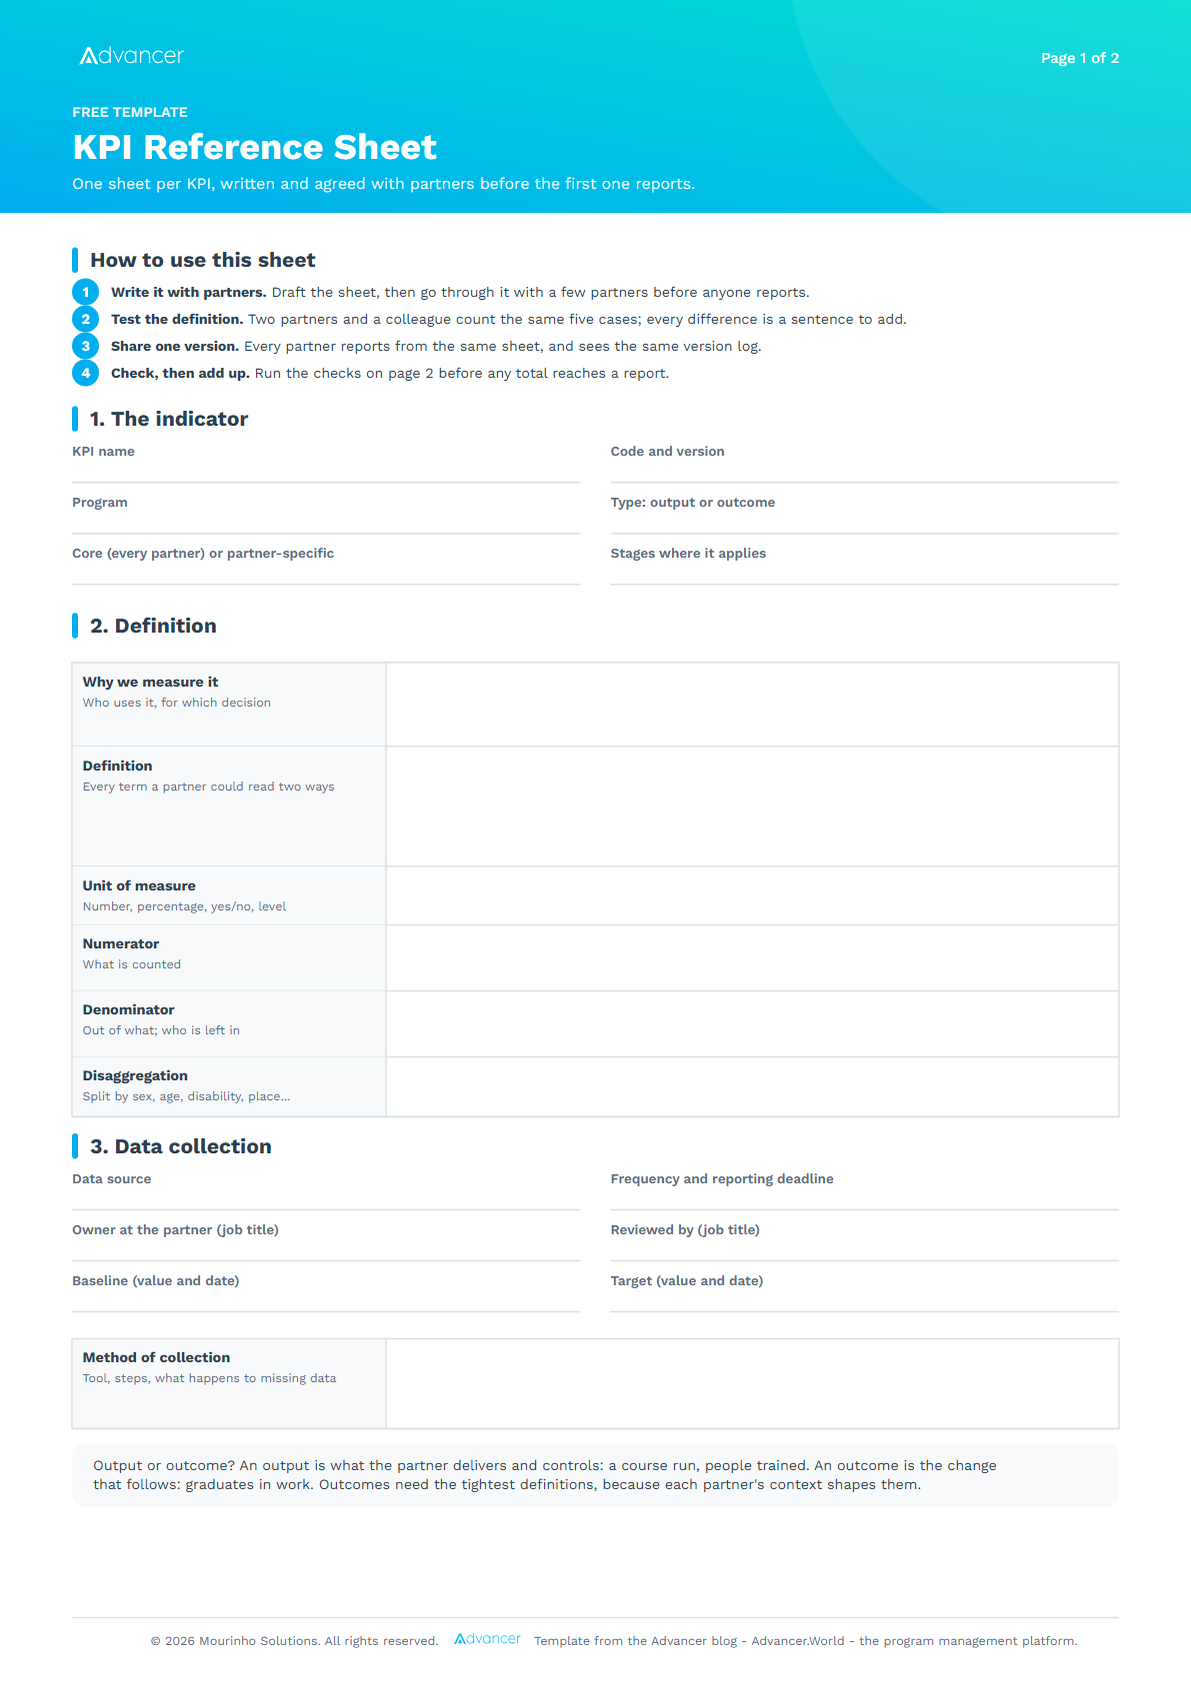
Download the KPI reference sheet template (PDF, 2 pages). Print one per KPI, or copy the fields into your own M&E plan.
Defining KPIs for more than a handful of partners? In Advancer.World you define each KPI once per program and record it per partner, next to where that partner stands on the program's stages. Daily snapshots keep the history, so the trend is there when you report. Free to start.
Example: one KPI, fully defined
Here is the sheet filled in for a core outcome KPI of the Youth Pathways Program, in which Horizon Child Fund works with 40 local partners that run employment courses for young people. Both are fictional.
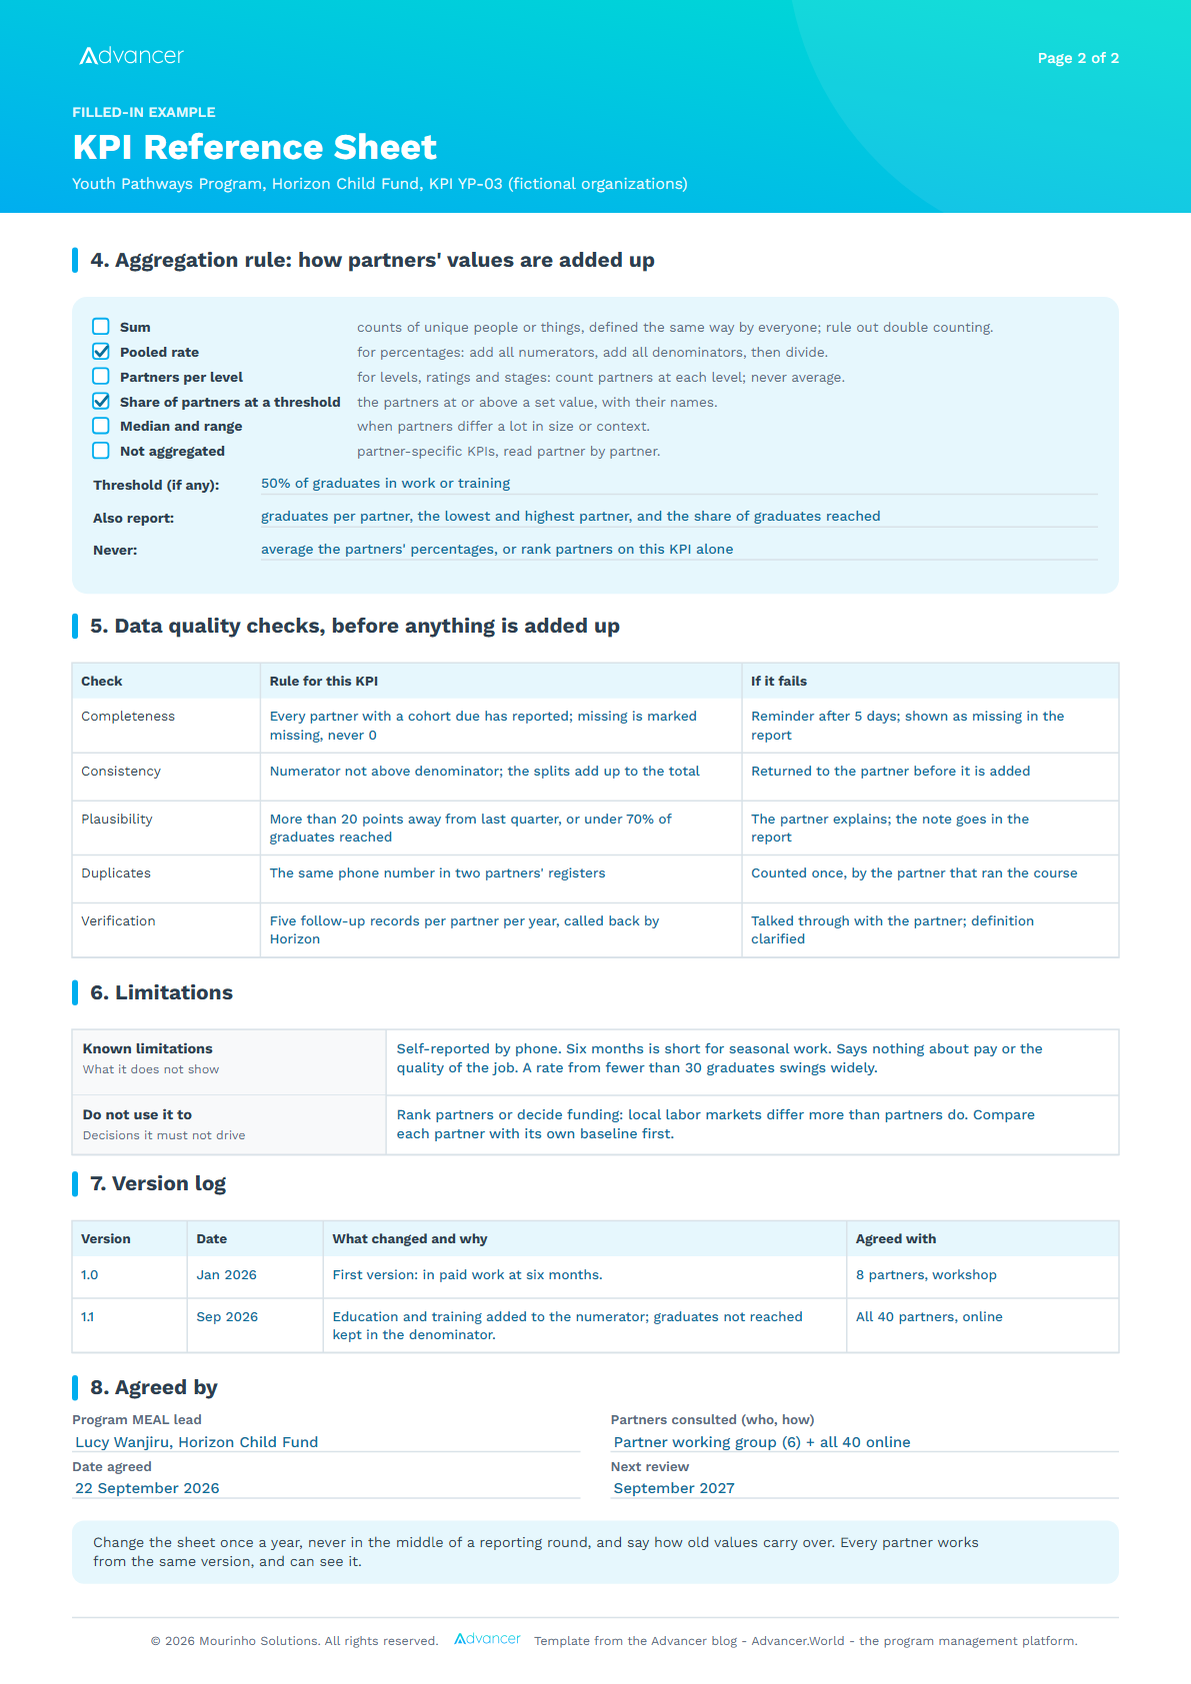
Download the filled-in example (PDF, 2 pages). Three choices are worth copying:
- Graduates nobody could reach stay in the denominator. Otherwise the partner that only reaches its success stories reports the best rate.
- The sheet says what it must not be used for. Ranking partners or deciding funding, because local labor markets differ more than partners do.
- The version log explains every break. When version 1.1 added education and training, the log said so, and nobody mistook a new definition for progress.
Adding it up: same data, three stories
Once the definitions hold, you decide how to add partners' values together. It sounds like arithmetic, and it is where most portfolio reports go wrong, because the same data supports opposite headlines.
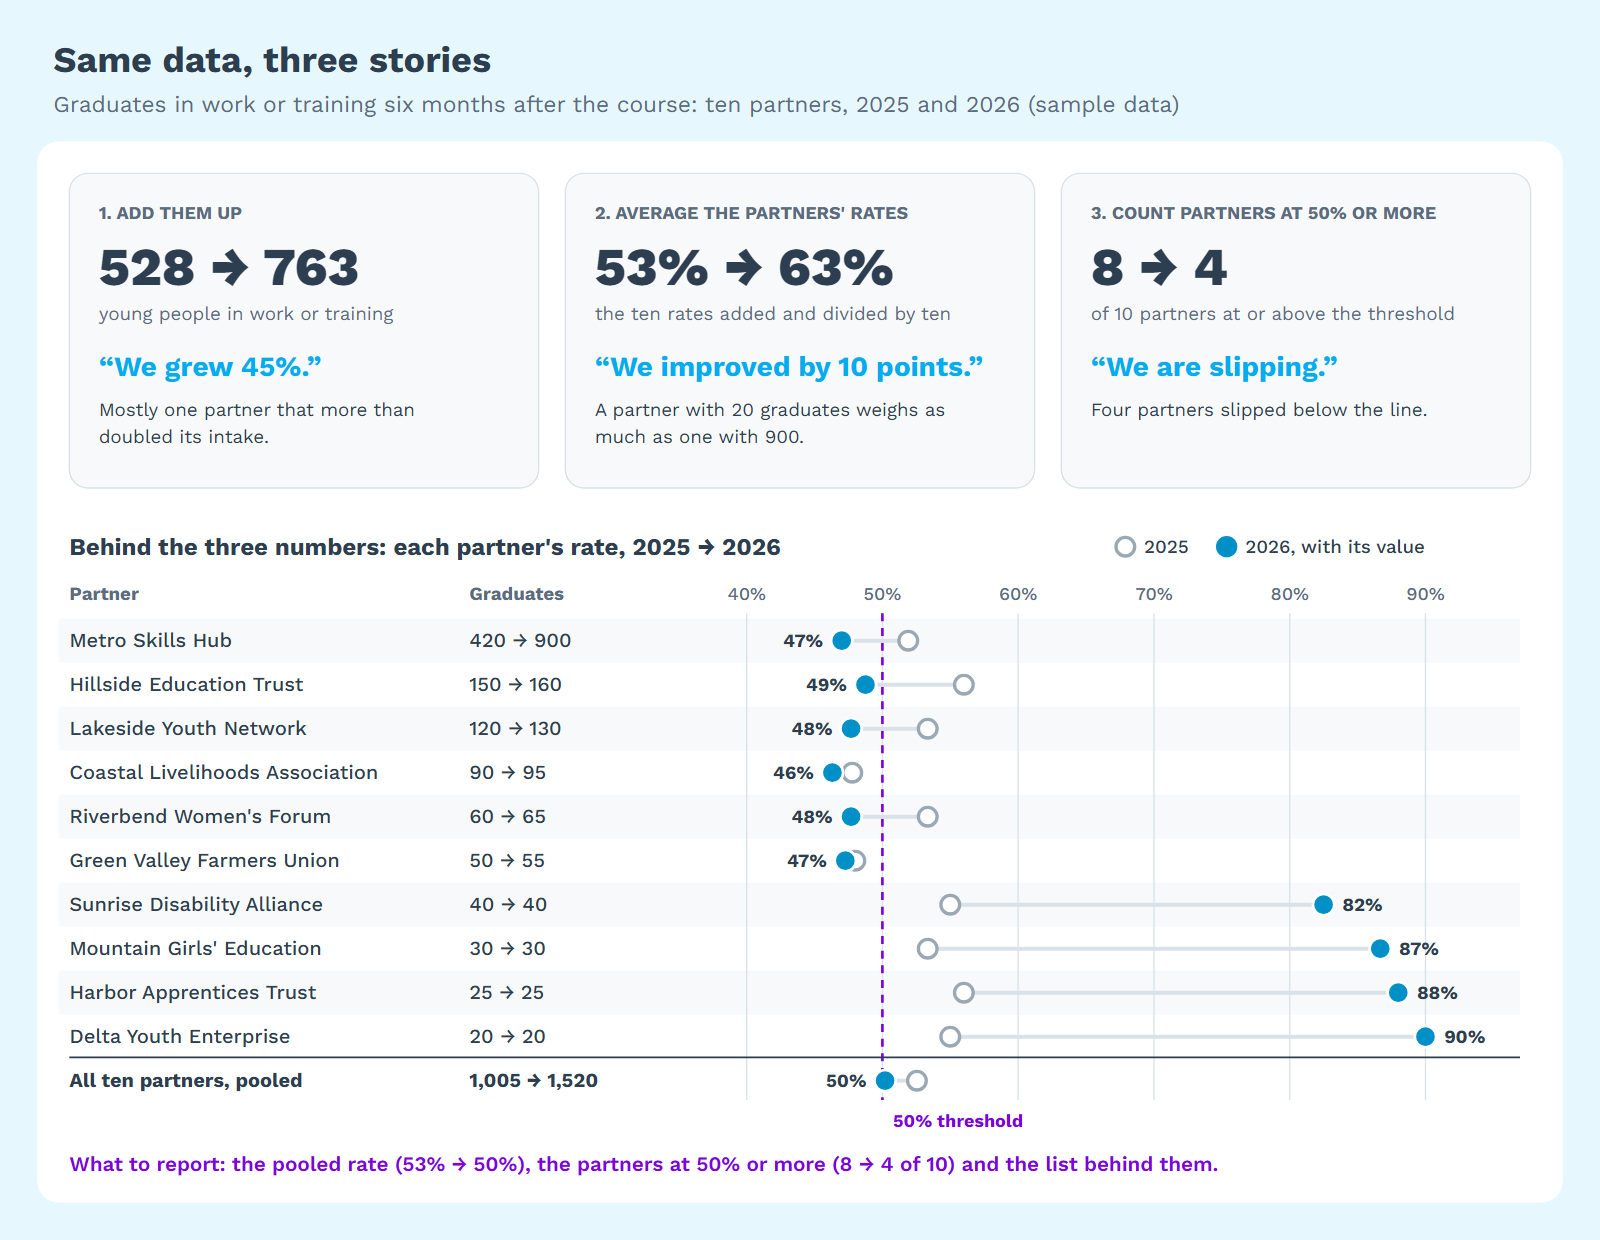
In this sample, young people in work or training rose 45 percent, mostly because one partner more than doubled its intake. The average of the ten partners' rates rose ten points, because four small partners did very well. The partners at the 50 percent threshold halved. All three are true. The honest summary is the pooled rate, down from 53 to 50 percent, with the four partners that slipped below the line named.
Averaging partners' percentages misleads twice over. It gives a partner with 20 graduates the weight of one with 900. And, as UNDP's handbook puts it, "averages tend to hide disparities" [4]: two partners at 90 percent and two at 10 average 50, like four at 50. Show the count next to every rate, too: with 20 graduates, one young person moves the rate five points. Levels and stages should not be averaged at all; count partners per level, as in our partner capacity assessment guide.
One more trap, from my years in operations research: a pooled rate can fall while no partner gets worse, if the growth happens at partners with lower rates. Before you ask who declined, ask who grew.
| Kind of KPI | Example | Add up with | Avoid |
|---|---|---|---|
| Count of unique people or things | Young people enrolled | Sum, after ruling out double counting | Adding counts defined differently |
| Percentage or rate | Graduates in work at six months | Pooled rate: all numerators over all denominators | Averaging partners' percentages |
| Level, rating or stage | A partner's stage in MEAL and data | The number of partners at each level | Averaging levels into a score |
| Yes or no | Safeguarding focal point in place | Share of partners with a yes, and which | Counting a missing answer as a no |
| Target or threshold | 50 percent or more in work | Share of partners at or above it, with names | A share without the names behind it |
Whatever the rule, report the program figure, how partners spread around it and the list behind it: every number on a board slide should lead back to the partners who produced it.
Check the data before you add it up
Adding up turns small errors into confident totals. The IFRC asks for procedures to check and clean data and to treat missing data, and names the usual causes of unreliable data: typing errors, duplicate entries, inconsistent data, and data deleted or lost [3]. UNDP's handbook names what is at stake: reliability (consistent measurement) and validity (measuring what was intended) [4]. Five checks cover most of it:
- Completeness. Every partner due has reported. Missing is marked as missing, never as zero.
- Consistency. No numerator is larger than its denominator, and the splits by sex or age add up to the total.
- Plausibility. A jump of more than 20 points since the last round gets a question, not a silent correction.
- Duplicates. The same person counted by two partners, or twice by one.
- Verification. A few records per partner per year, checked against the register or the call log.
Run them as questions to the partner, not as an audit. A flagged value is often a definition problem, and the fix belongs on the reference sheet, for everyone.
Match KPIs to the stage a partner is in
If your program runs on a maturity path, the right KPIs change as a partner moves along it: a KPI that matters at stage 2 may tell you nothing at stage 4. The example program has four stages:
| Stage | What the partner is building | KPIs that tell you something |
|---|---|---|
| 1 Starting | A course that runs well | Enrollment by sex and age; course completion |
| 2 Delivering | A follow-up call for every graduate | Share of graduates reached; the work-or-training KPI begins, as a baseline |
| 3 Connecting | Links with employers | The work-or-training KPI against its target; placements offered |
| 4 Leading | Lasting, decent work | Graduates still in work at 12 months; the partner's own indicators |
Two rules follow. Do not hold a partner to an outcome it is not yet set up to influence: a placement rate from a stage 1 partner measures its district, not its work. And retire a KPI once nearly every partner meets it: course completion matters at stage 1, but at stage 4, with every partner above 90 percent, it separates nobody and informs no decision. Both rules depend on knowing each partner's current stage, and there are three ways to keep it current: partners assess themselves, the work they complete moves them, or your team decides. For describing the stages themselves, see our guide to building a maturity model.
How many KPIs is too many?
Do the multiplication first. Six core KPIs, each split four ways and reported quarterly by 40 partners, make 3,840 numbers a year. Twelve KPIs split eight ways make 15,360. Each one is typed by someone at a partner and checked by someone on your team. The IFRC's advice is to monitor only what is necessary and sufficient, because "extra information is more often a burden than a luxury" [3]. UNDP's handbook puts credibility, not the volume of data, at the heart of good indicators [4].
My test for every KPI has three questions: who looks at it, which decision does it change, and what will we do if it drops? If nobody can answer all three, it is not core. That usually leaves five to eight shared KPIs, two or three per partner, and a few that switch on and off with the stage.
Running your KPIs in Advancer.World
Advancer.World was born from the digital transformation of programs at organizations such as UNICEF and Airbus. A program is a grid of stages and topics, and the steps between stages carry the work: initiatives, surveys, document uploads for the evidence behind a figure.
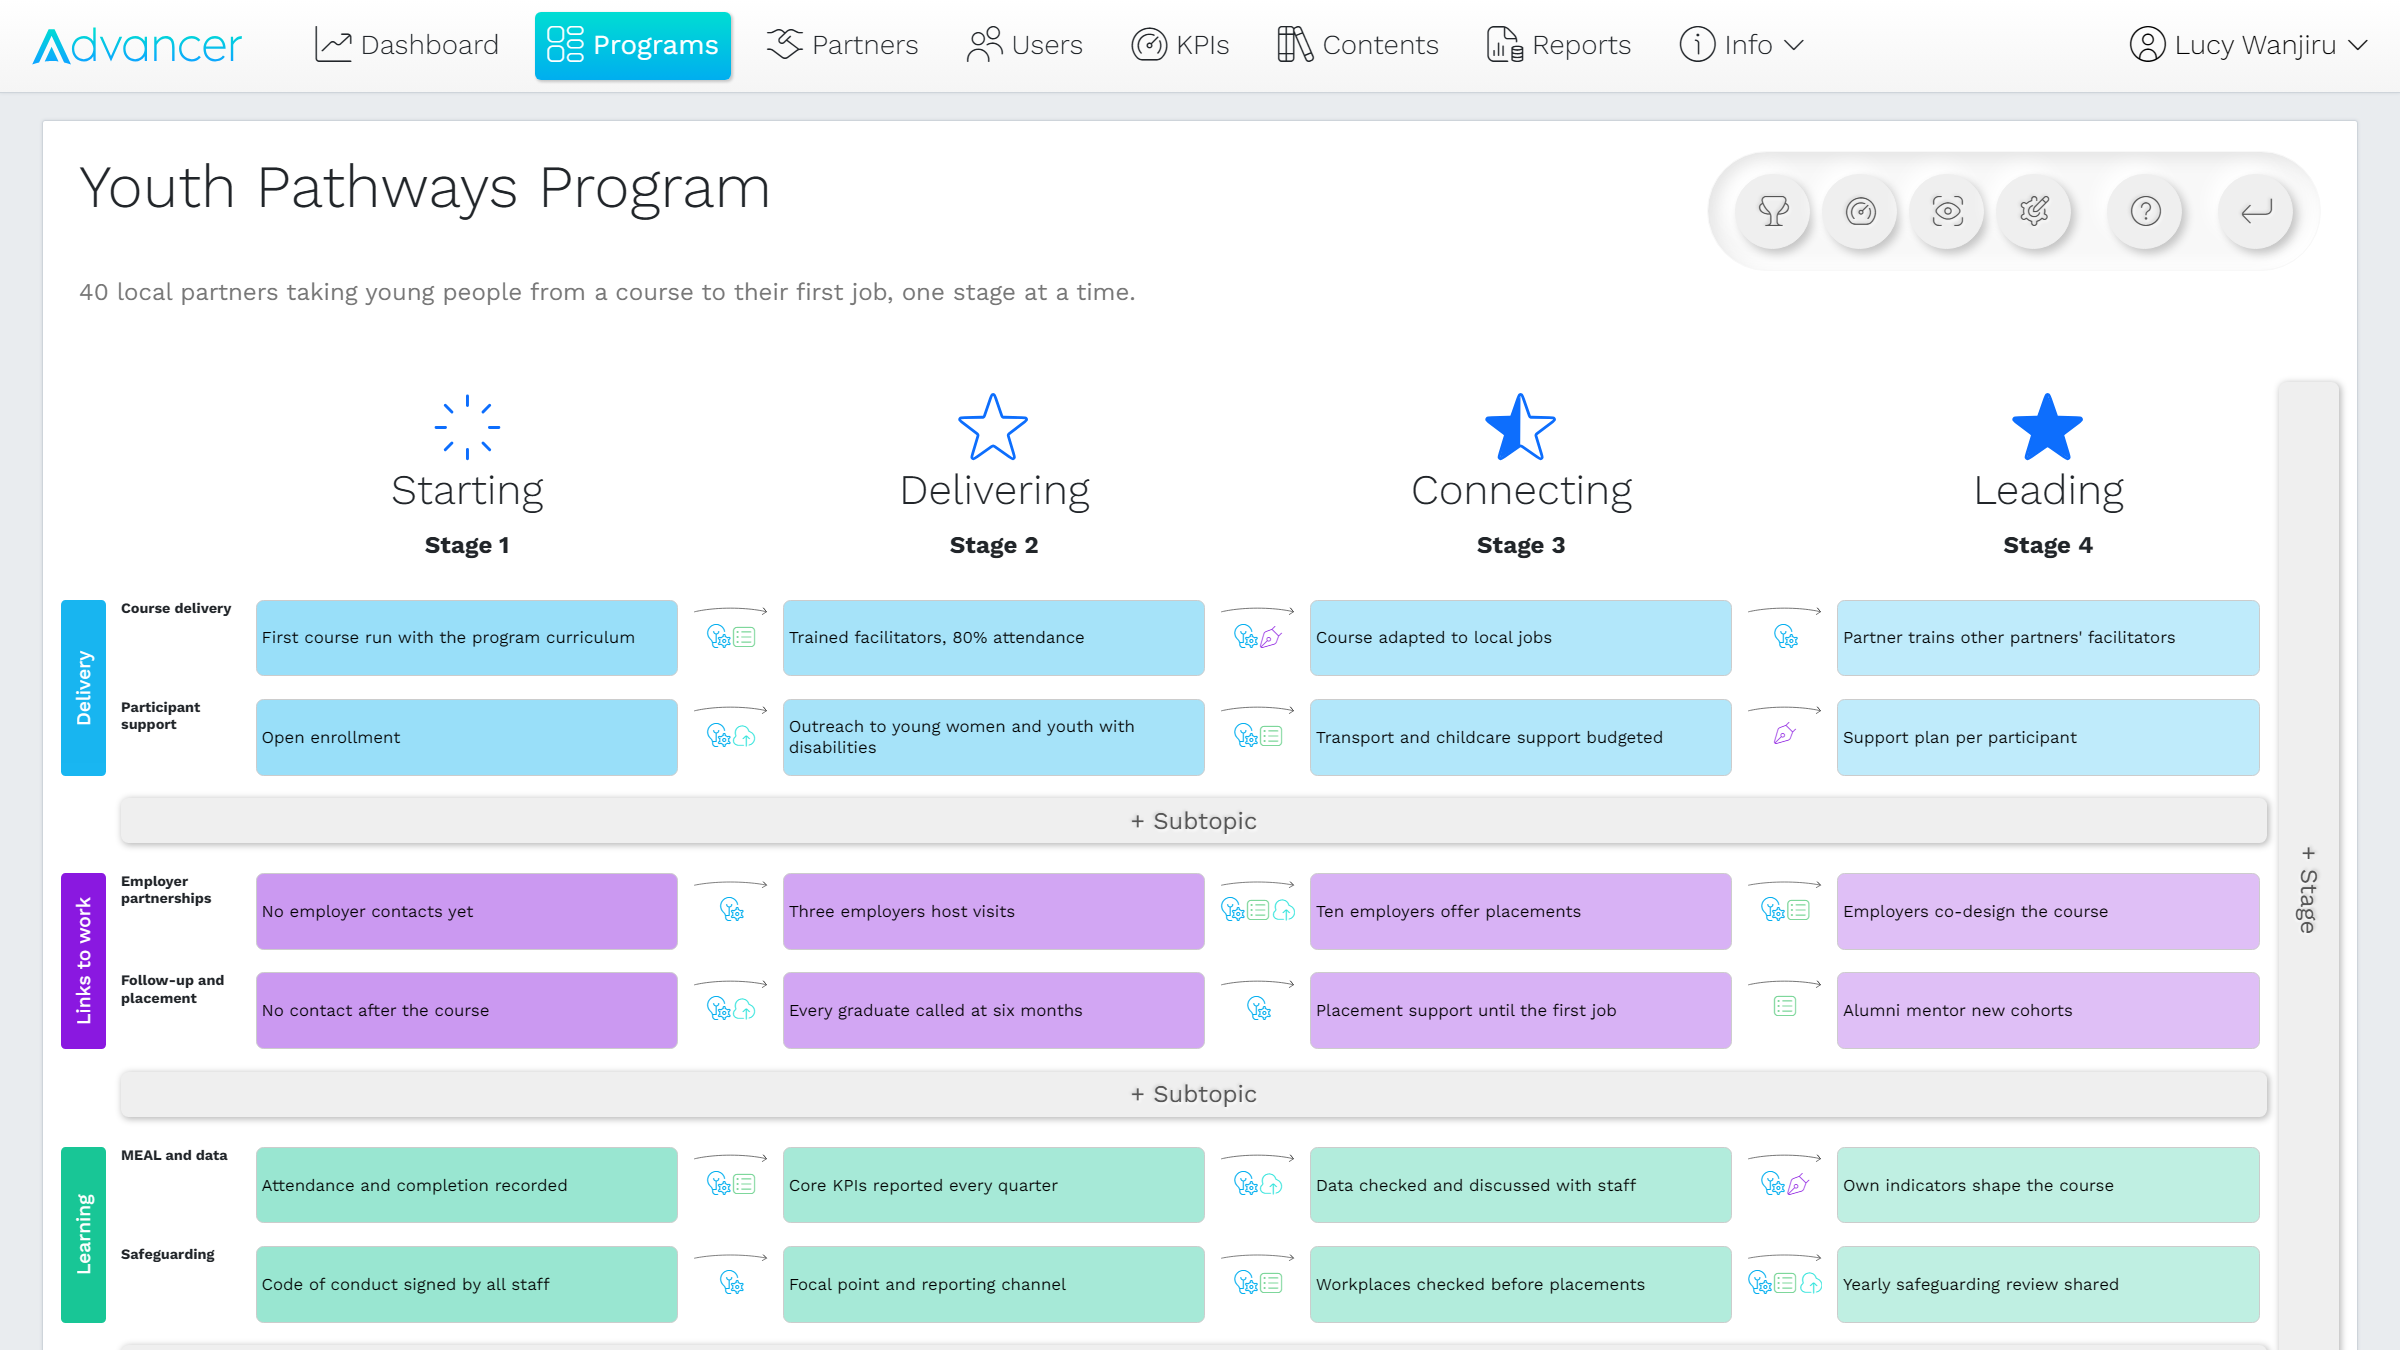
KPIs are defined once per program and recorded per partner, so every partner reports against the same KPI. Partners see their own position and what the next stage asks of them, in any of 22 languages, and never another partner's data. Daily snapshots keep the history for Excel reports and AI-written Word reports with charts. On the Gold and Enterprise plans, the REST API and the MCP server can read a partner's scorecard, its position on each subtopic and its KPI values, and the program's trends. The Free plan's five KPIs are enough to pilot a shared core with a few partners.
FAQ
What is the difference between a KPI and an indicator?
Every KPI is an indicator, but not every indicator is a KPI. KPIs are the subset considered most important to the goals and monitored continuously [1]. In a multi-partner program, the shared core is your KPIs; other indicators serve partners and teams as they need them.
Should implementing partners choose their own indicators?
Some of them, yes. Shared KPIs need common definitions, agreed with partners; partner-specific indicators are the partner's choice. The IFRC recommends that the M&E plan be developed by those who will use it, which also helps data quality [3].
How do you aggregate percentages across partners?
Add all the numerators, add all the denominators, then divide. Never average the partners' percentages, and report the result with the partners at or above your threshold, by name.
Start with the KPI you trust least
You do not need a new framework to start. Take the core KPI you trust least, fill in a reference sheet for it with two or three partners, and ask each of them to count the same five cases. The differences will tell you what to write down. Then do the next one.
One definition, every partner, every round. Set up your program's core KPIs, invite your partners, and report from the same data in Excel or an AI-written Word report, with the history kept. Partners never pay. Free to start.
References
- OECD, "Glossary of Key Terms in Evaluation and Results Based Management for Sustainable Development (Second edition)", OECD Publishing, Paris, 2023, https://alnap.org/documents/20488/OECD_glossary_key_terms_eval_rbm_sd-fr-es.pdf (accessed October 2026).
- Nigel Simister, INTRAC, "Summarising portfolio change: results frameworks at organisational level", M&E Paper 10, January 2016, https://www.intrac.org/resources/paper-10-summarising-portfolio-change-results-frameworks-organisational-level/ (accessed October 2026).
- International Federation of Red Cross and Red Crescent Societies, "Project/programme monitoring and evaluation (M&E) guide", Geneva, 2011, https://www.ifrc.org/sites/default/files/2021-09/IFRC-ME-Guide-8-2011.pdf (accessed October 2026).
- United Nations Development Programme, "Handbook on Planning, Monitoring and Evaluating for Development Results", New York, 2009, http://web.undp.org/evaluation/handbook/documents/english/pme-handbook.pdf (accessed October 2026).
© 2026 Mourinho Solutions. All rights reserved.